Reaction Back Into The Trading Range In Progress?
The last three weeks we have been expecting some type of reaction back into the trading range, and we gave the reasoning behind it. We finally closed this week with a reaction in progress, on decreased holiday volume. With the holiday’s now behind us, we will be interested in watching how this reaction further develops.
As we have discussed the last few weeks, the rally to “V” was on a lack of demand, and not consistent with a Sign of Strength. Then we experienced sideways action to “W”. This was not as deep of a reaction that we had been expecting at the time. Then the Wyckoff Wave began another rally attempt through the supply at the top of the trading range at “X”. Once again volume did not expand so it did not appear to be a Sign of Strength, or better known as a Jump Across The Creek. We then pulled back to “Y” on low volume, and had the most recent rally to point “Z”.
The rally to “Z” returned the Technometer to an overbought reading quickly with no material price gain in the Wave above “X”. We have circled this overbought reading on the Technometer with the blue circle at the bottom of the chart. As you can see, the overbought Technometer readings at “T”, “V”, “X”, and now “Z”, stopped all of the rallies, but only gave us sideways action before another rally to new highs for the move. But also the successive rallies displayed slowing of thrust, and appeared tired.
The decline from “Z” thus far is taking out the low at “Y” which would be a change in character for the last two months uptrend.
Not expected…but this pullback could possibly be a Last Point of Support (LPS), but our current indications is this is not true. If strong demand returns in next few days, we will reevaluate this possibility.
The S&P and Nasdaq Indices were down approximately 1% for the week, and weaker than the Wyckoff Wave.
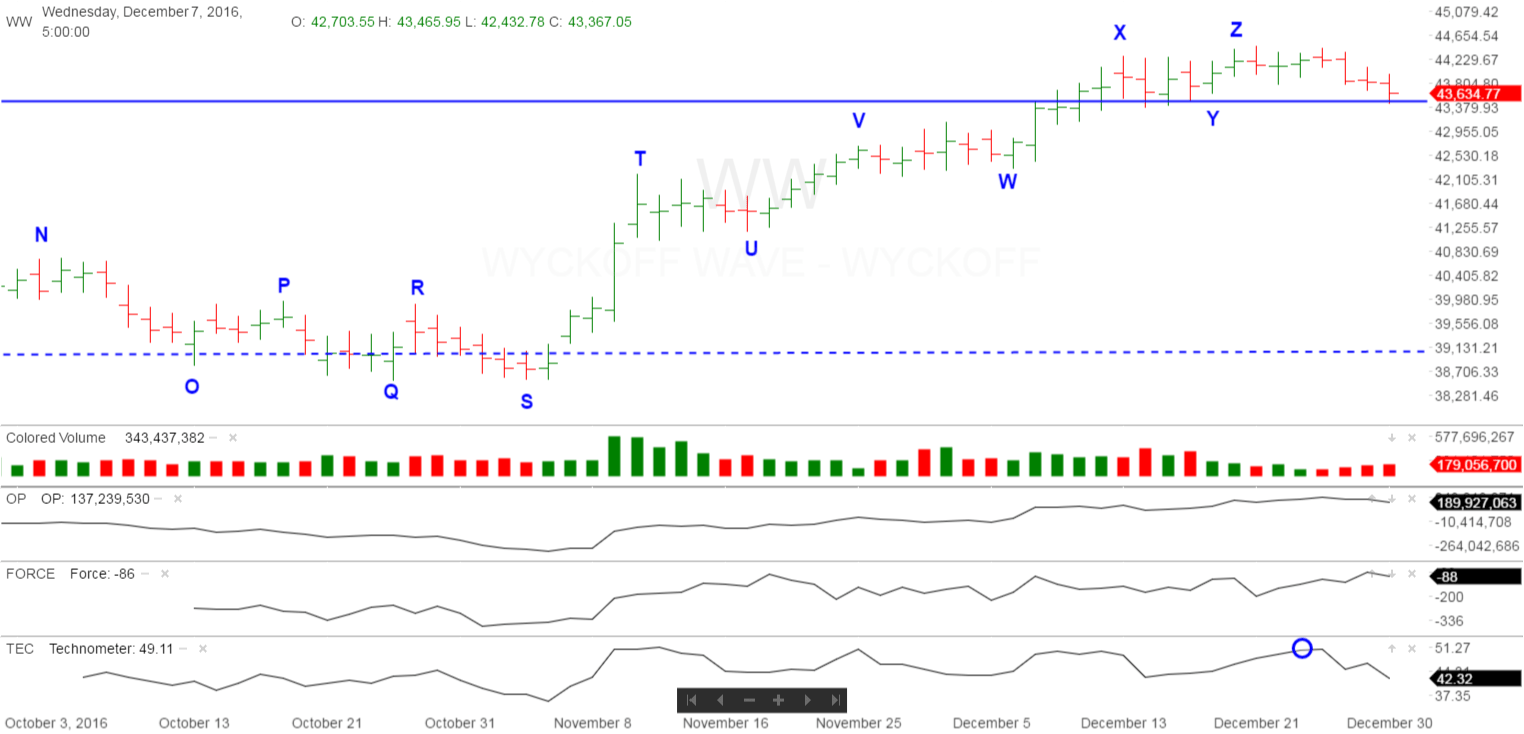
This weeks action, supports the fact that the recent rally to “Z” is simply a rally to test the resistance at the top of the trading range. We therefore expect a correction back to the middle or lower portion of the recent trading range, and wait for ending action once again.
Currently the supply at the top of the trading range has not been sufficient to turn the Wyckoff Wave back into the trading range. Last weeks overbought Technometer reading has finally given us a more important correction, and we will be curious to see if there is more to come in the week ahead.
The Optimism – Pessimism Index is in sync with the Wyckoff Wave.
The moderate negative readings from the Force Index has supported the idea of a correction here. The force index was in a minor divergence with the Wave into last weeks high, but now the Force index held up much better during the last 7 days correction. We would like to see the Force Index increase to the downside here to keep the correction in force.
We had mentioned last week that the overbought Technometer reading should turn us back down into the trading range. So far that appears to be occuring, but the light holiday volume raises a question mark. Let’s see if we can extend the correction a few more days with volume increasing, before the Technometer becomes oversold.
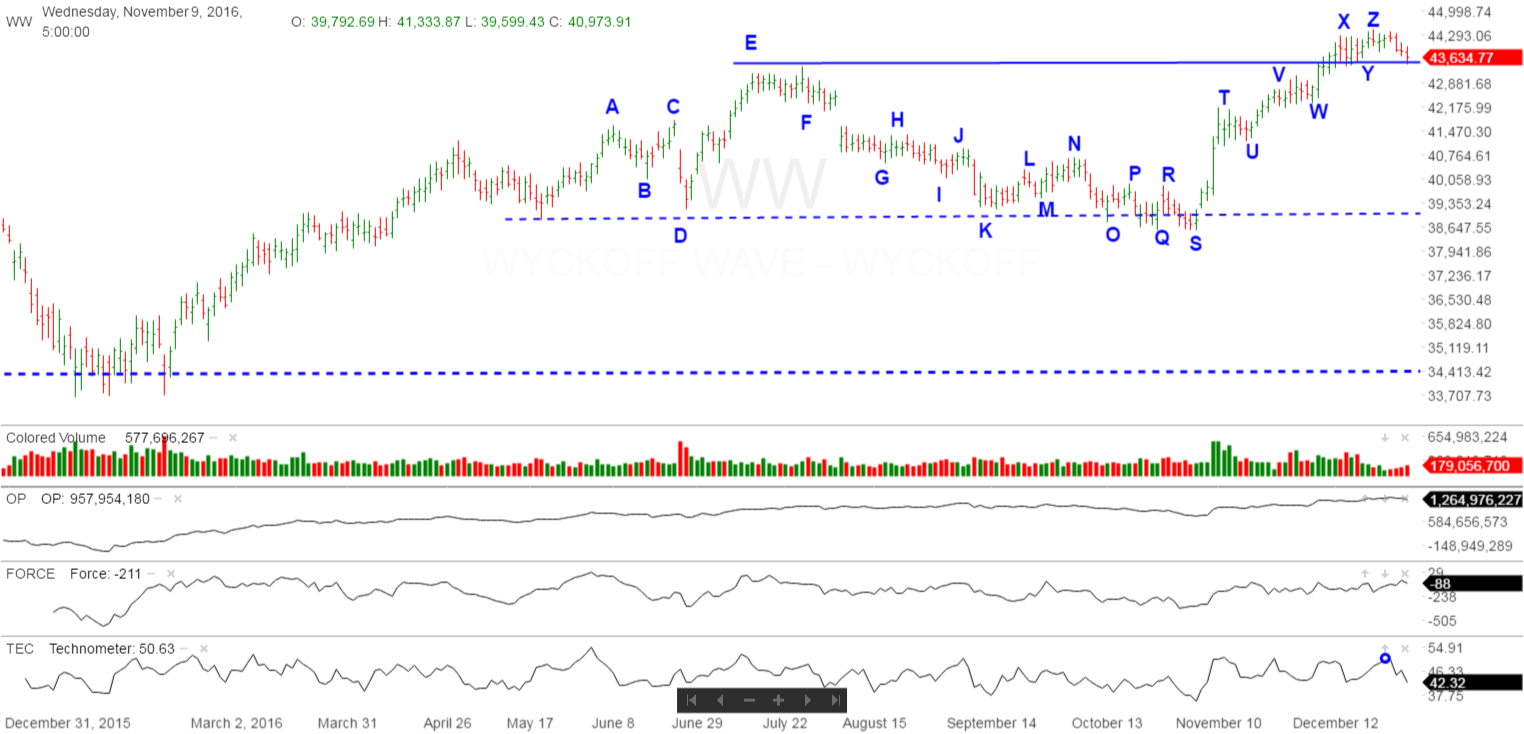
The recent trading action still supports the reaction scenario back into the middle of the recent trading range at “U”.
While the Wyckoff Wave will most probably not be putting in a Last Point of Support on any expected reaction here. The market action beginning with the selling climax in August 2015, continues to suggest we are in a period of accumulation. If so, the Wyckoff Wave would experience ending action and the bull market would then continue.
Good Trading,
Todd Butterfield
Responses