Santa Claus Rally…
The last two weeks we have been expecting some type of reaction back into the trading range, and we gave the reasoning behind it. We closed this last week slightly higher again, on much lower holiday volume. The correction thus far has been a sideways affair in most indices. It will be interesting to see how we trade once we get this holiday trading behind us.
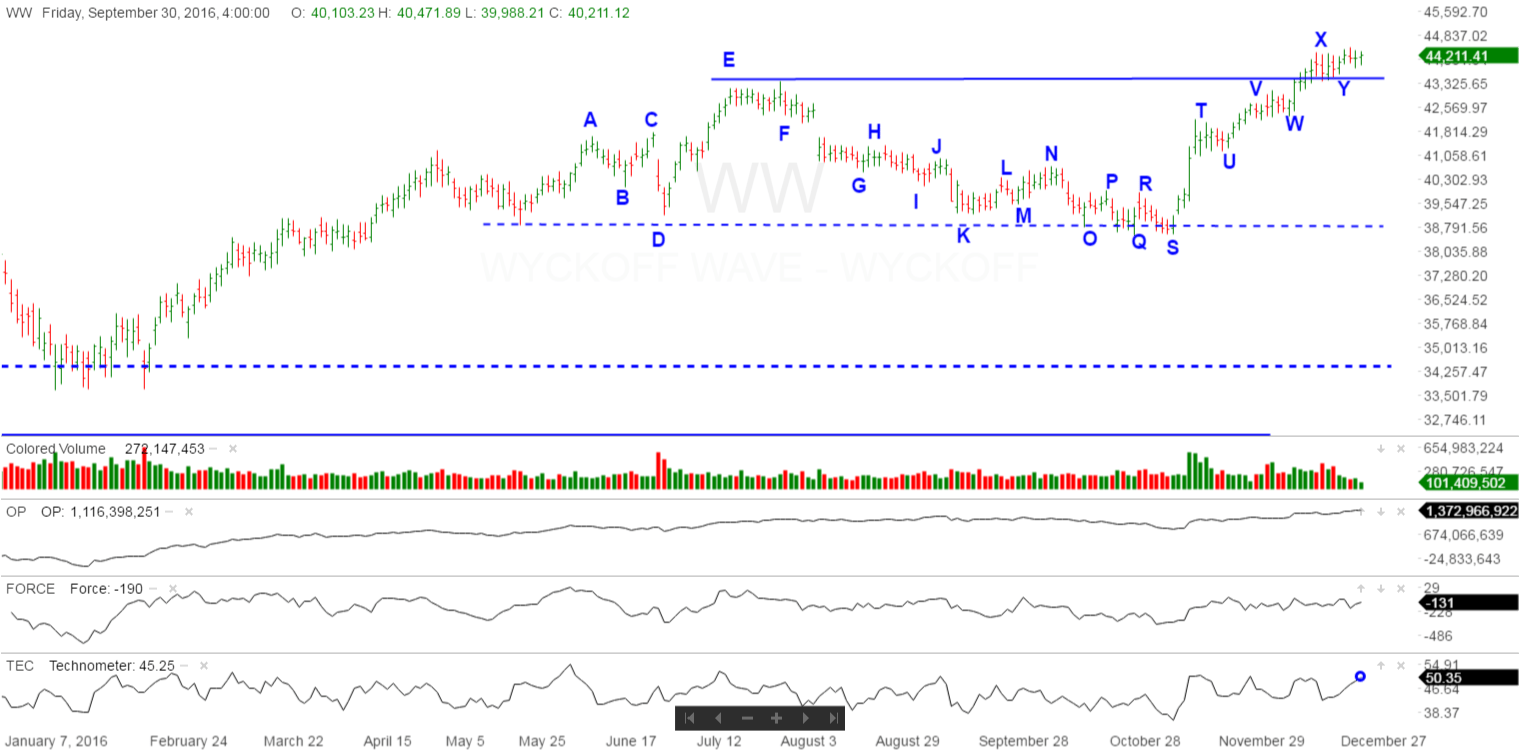
As we have discussed the last few weeks, the rally to “V” was on a lack of demand, and not consistent with a Sign of Strength. Then we experienced sideways action to “W”. This was not as deep of a reaction that we had been expecting. Then the Wyckoff Wave began another rally attempt through the supply at the top of the trading range at “X”. Once again volume did not expand so it did not appear to be a Sign of Strength, or better known as a Jump Across The Creek. We then pulled back to “Y” on low volume, and had the most recent rally into Friday’s close.
The minor rally this past week returned the Technometer to an overbought reading quickly with no material price gain in the Wave. We have circled this overbought reading with the blue circle at the bottom of the chart. As you can see, the overbought Technometer readings at “T”, “V”, and “X” stopped all of the rallies, but only gave us sideways action before another rally to new highs for the move. It will be interesting to see how Friday’s overbought reading will play out from here. The rallies after we came off of overbought have become less impressive each time thus far.
Not expected… but if the Wyckoff Wave does continue higher here, through the supply at the top of the trading range on strong volume, we should have a good entry point for longs on the expected reaction after the rally.
The S&P and Nasdaq Indices were also slightly higher for the week.

The last few weeks action, still supports the fact that the rally is simply a rally to test the resistance at the top of the trading range. We therefore expect a correction back to the middle or lower portion of the recent trading range, and wait for ending action once again.
Currently the supply at the top of the trading range has not been sufficient to turn the Wyckoff Wave back into the trading range. We would expect the current overbought reading to give us another opportunity for a more important correction.
The Optimism – Pessimism Index is in sync with the Wyckoff Wave.
The moderate negative readings from the Force Index support the idea of a correction here. The force index is in a minor divergence with the Wave from point “T” to last weeks rally high marked as “X”, as well as last weeks high. The Wave has continued to advance, while the Force Index has been moving sideways at best. The Force Index is also at a lower top when compared to the more important point “E”.
We had mentioned last week here that the neutral Technometer reading could allow us to test the high once again, and it did just that with Wednesday’s new high. It was unimpressive, quickly took the Technometer back to overbought, so we still expect a correction here.
The negative indications still support the reaction scenario back into the middle of the recent trading range at “U”.
While the Wyckoff Wave will most probably not be putting in a Last Point of Support on any expected reaction here. The market action beginning with the selling climax in August 2015, continues to suggest we are in a period of accumulation. If so, the Wyckoff Wave would experience ending action and the bull market would then continue.
Good Trading,
Todd Butterfield
Responses