Reaction Slow to Materialize…
Last week we discussed how we were still expecting a reaction, and the reasoning behind it. We closed this week exactly where we ended the previous week on the Wyckoff Wave. The correction thus far has been a sideways affair.
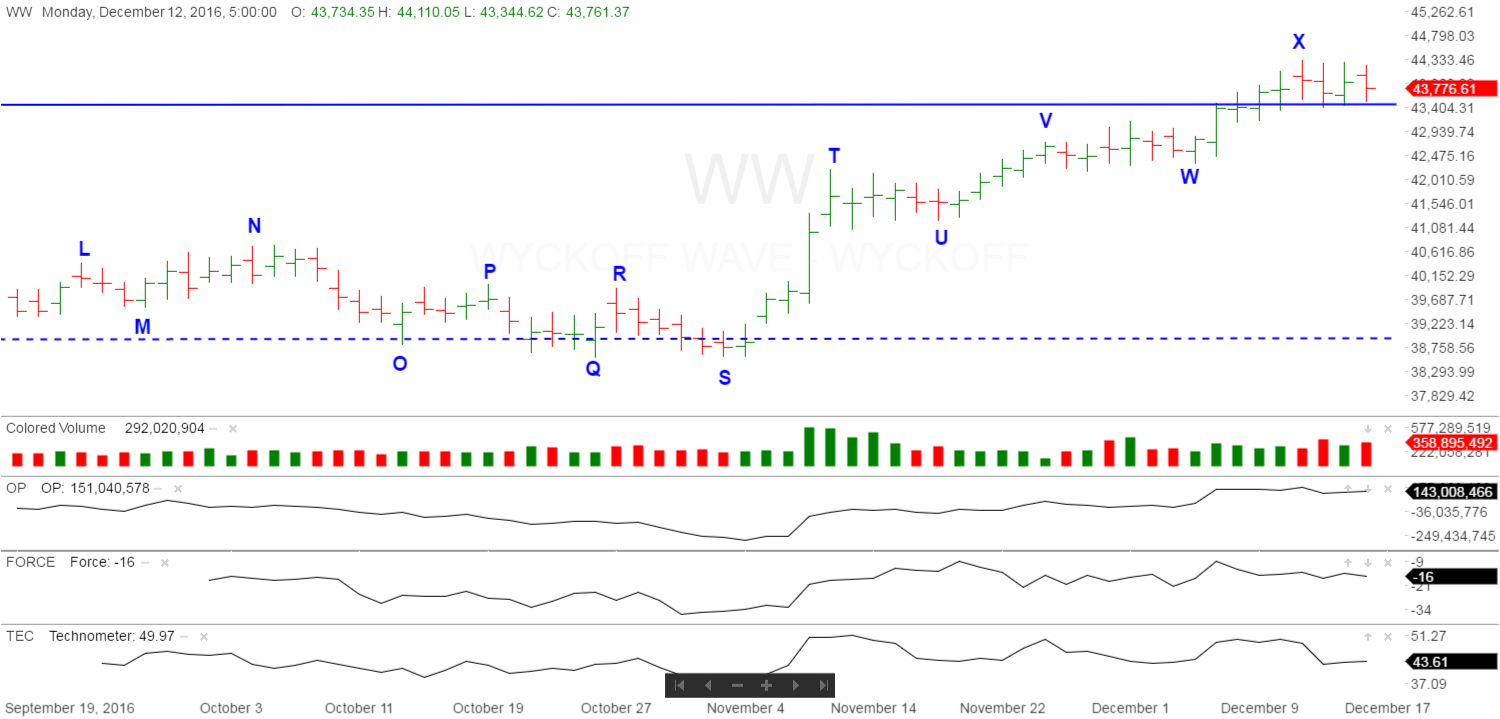
As we have discussed the last few weeks, the rally to “V” was on a lack of demand, and not consistent with a Sign of Strength. Then we experienced sideways action to “W”. This was not as deep of a reaction that we had been expecting. Then the Wyckoff Wave began another rally attempt through the supply at the top of the trading range at “X”. Once again, volume did not expand so it does not appear to be a Sign of Strength, or better known as a Jump Across The Creek. We have been of the opinion that it is a rally to the top of the resistance, and we expected a reaction here. This reaction has started off slow, with no downside progress, only sideways action.
If the Wyckoff Wave does continue higher here, through the supply at the top of the trading range, we should have a good entry point for longs on the expected reaction after the rally.
The S&P and Nasdaq Indices were also basically unchanged for the week.
The last few weeks action, still supports the fact that the rally is simply a rally to test the resistance at the top of the trading range. We therefore expect a correction back to the middle or lower portion of the recent trading range, and wait for ending action once again.
Currently the supply at the top of the trading range has not been sufficient to turn the Wyckoff Wave down into the lower portion of the range. We would like to give it this week to accomplish a more important correction.
The Optimism – Pessimism Index is only slightly underperforming the Wyckoff Wave.
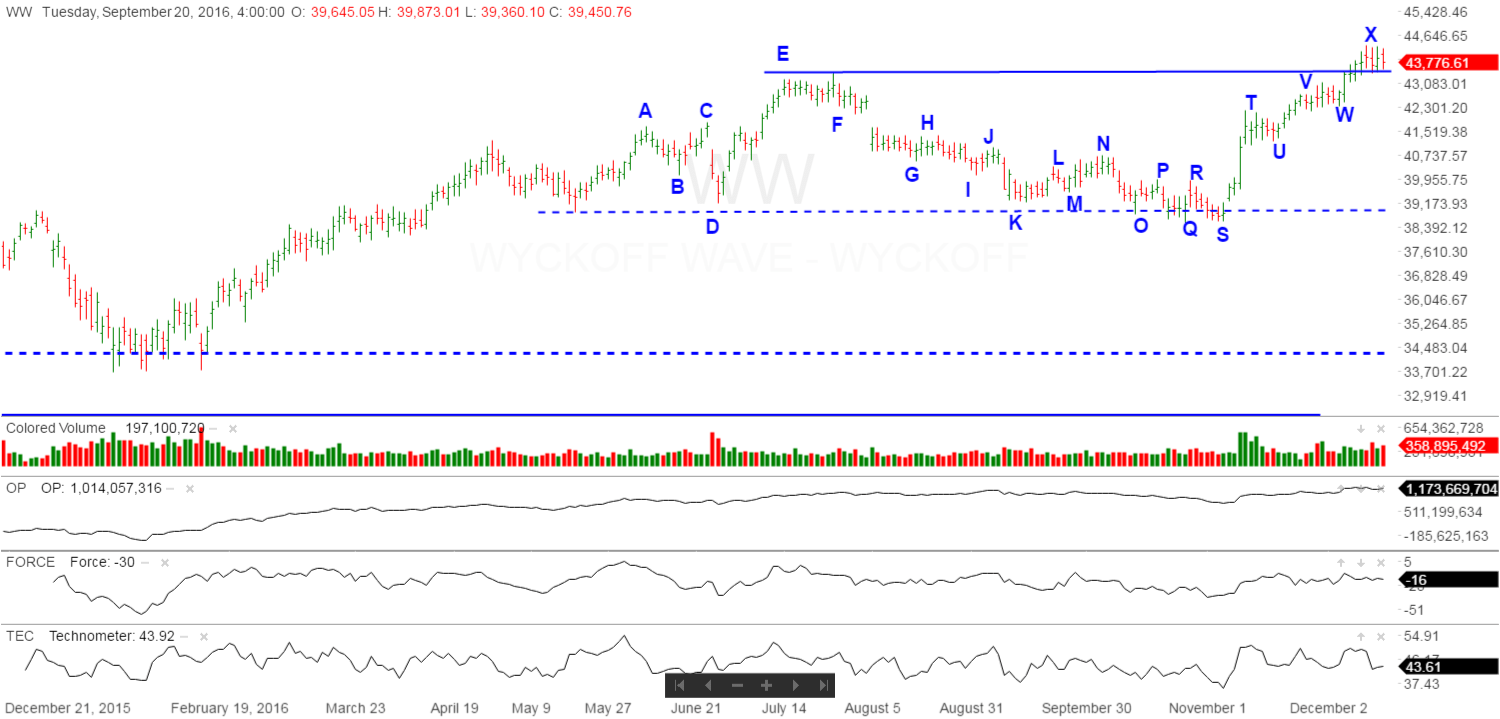
The moderate negative readings from the Force Index does not have a mitigating impact on the expected reaction. The force index is in a minor divergence with the Wave from point “T” to last weeks rally high marked as “X”. The Wave continued to advance, while the Force Index has been moving sideways at best. The Force Index is also at a lower top when compared to the more important point “E”.
The Technometer’s overbought reading at “V” stopped the rally as expected. The Technometer once again stopped the rally at “X” but has not pushed the Wyckoff Wave into a more serious correction as of yet. The Technometer is now back to neutral, and will register oversold very quickly on a selloff. We must get the correction started quickly, or we could be subject to another short term rally back to the test the highs.
The negative indications still support the reaction scenario back into the middle of the recent trading range at “U”, and possibly even testing the lows at the bottom of the range scenario at “S”.
While the Wyckoff Wave will most probably not be putting in a Last Point of Support, the market action, beginning with the selling climax in August 2015, continues to suggest we are in a period of accumulation. If so, the Wyckoff Wave would experience ending action and the bull market would then continue.
Good Trading,
Todd Butterfield
Responses