Still Expecting a Reaction Off The Top of The Trading Range.
As we discussed two weeks ago, the rally to “V” was on a lack of demand, and not consistent with a Sign of Strength. Then we experienced sideways action to “W” which ended Tuesday of this week. This was not as deep of a reaction, that we was expecting this past week. Then the Wyckoff Wave began another rally attempt through the supply at the top of the trading range. Once again, volume has not expanded so it does not appear to be a Sign of Strength, or better known as a Jump Across The Creek. We have been of the opinion that it is a rally to the top of the resistance, and we expect a reaction here. We will be anxious to see how it reacts, if it indeed does.
If the Wyckoff Wave does continue higher here, through the supply at the top of the trading range, we should have a good entry point for longs on the expected reaction after the rally occurs.
The S&P and Nasdaq Indices also experienced an up week, with good price spread and average volume.
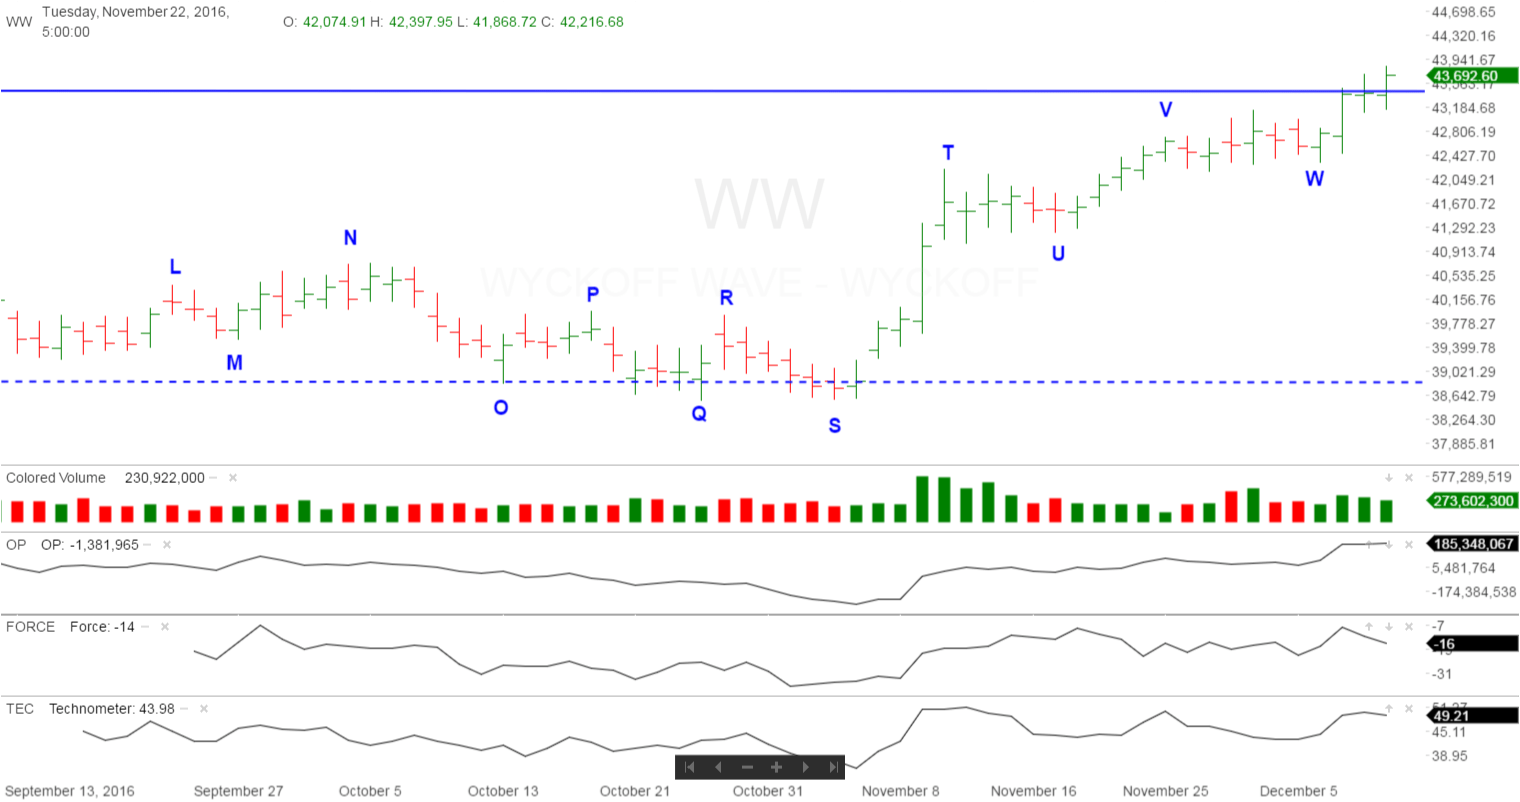
The last few weeks action, still supports the fact that the rally is simply a rally to test the resistance at the top of the trading range. We therefore expect a correction back to the middle or lower portion of the recent trading range, and wait for ending action once again.
One important purpose of a trading range, especially one that appears to be accumulation, is the drying up supply. This is done by taking in stock sold by weak holders. Supply is found at different levels within the trading range. Currently the supply at the top of the trading range appears sufficient to turn the Wyckoff Wave down into the lower portion of the range.
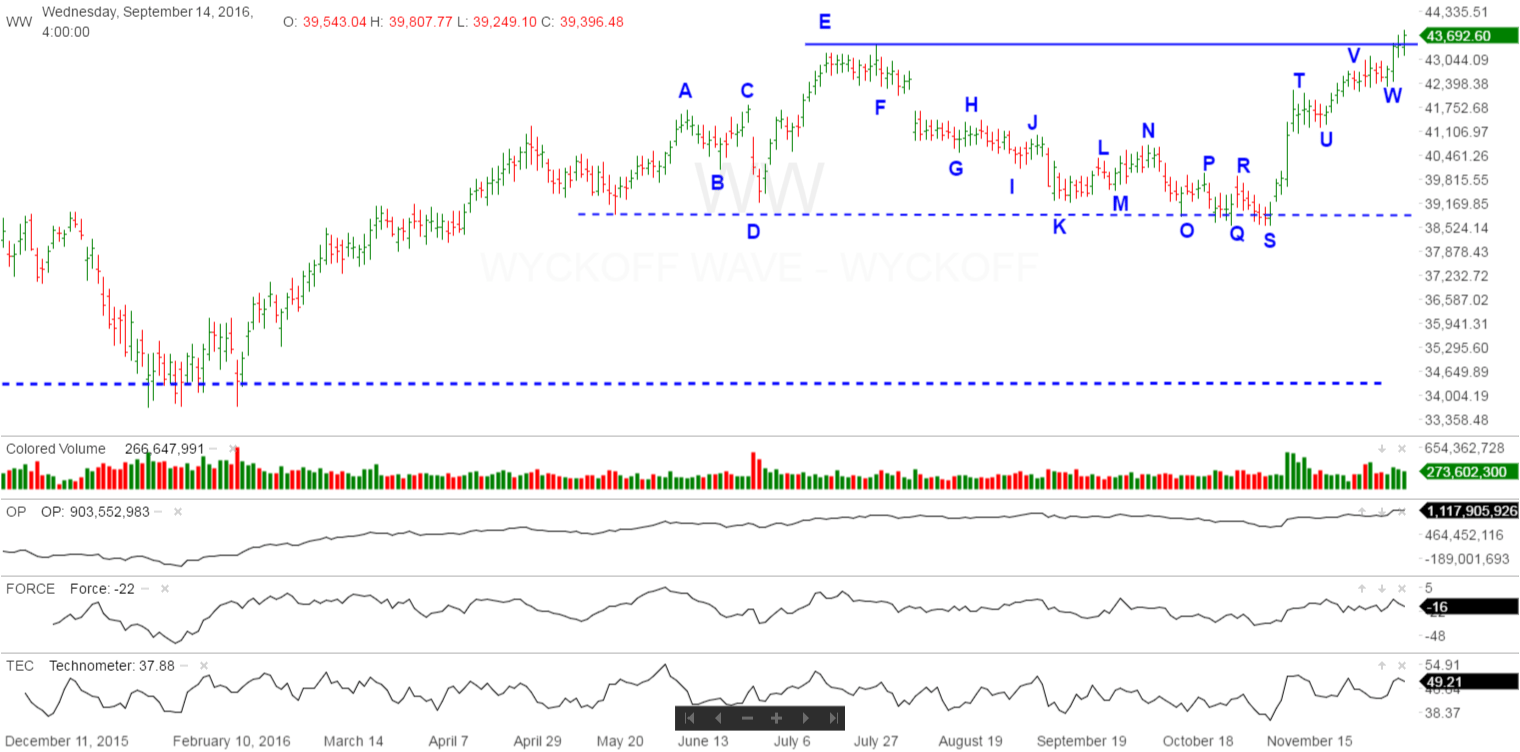
The Optimism – Pessimism Index did reach a new high this week, and is only slightly underperforming the Wyckoff Wave to the upside.
The moderate negative readings from the Force Index does not have a mitigating impact on the expected reaction. The force index is in a minor divergence with the Wave from point “T” to this weeks rally high. The Wave is continuing to advance, while the force index has been moving sideways. The force index is also at a lower top when compared to the more important point “E”.
The Technometer’s overbought reading at “V” did stop the rally as expected. The Technometer has once again moved into an overbought reading as we would expect it to stop this rally as well.
These negative indications still support the reaction scenario back into the middle of the recent trading range at “U”, and possibly even testing the lows at the bottom of the range scenario at “S”.
While the Wyckoff Wave will most probably not be putting in a Last Point of Support, the market action, beginning with the selling climax in August 2015, continues to suggest we are in a period of accumulation. If so, the Wyckoff Wave would experience ending action and the bull market would then continue.
Good Trading,
Todd Butterfield
Responses