The Wyckoff Wave still trading quietly in the middle of the range
Click the following link if you would like to also view a video we did Thursday on the components of the Wyckoff Wave. https://youtu.be/NWptdcGlzVw
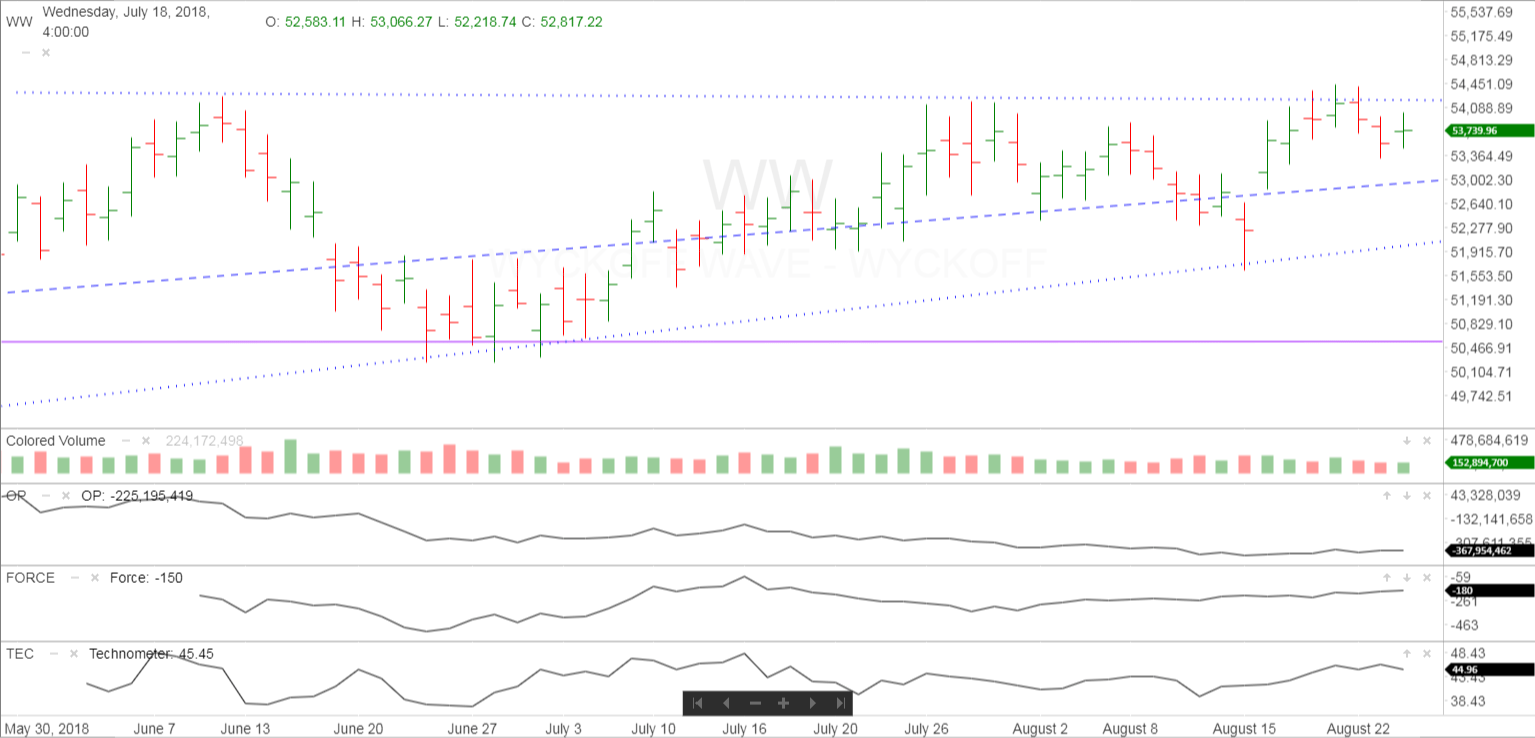
The Wyckoff Wave traded flat for the week with very little volatility. Volume still trading at slightly lower levels.
The O-P continues to trade very sluggish, and not rallying off the lows.
The Force Index increased slightly for the week.
The Technometer closed the week slightly above neutral.
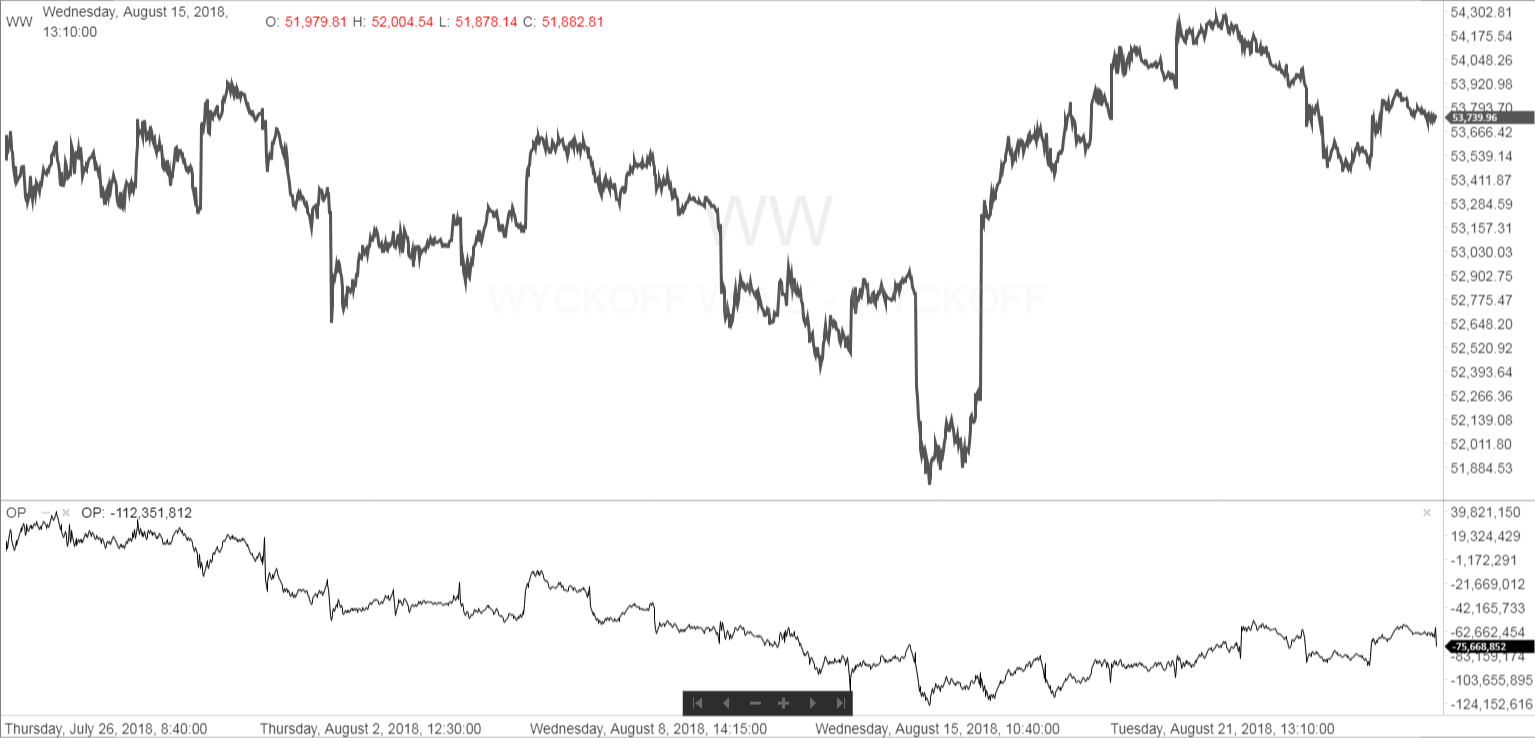
The intraday chart for last week showed the OP leading the way low, before rallying slightly on Friday’s rally. Thus far it has not rallied in unison with the Wave which is a worrisome sign. The OP will need to expand to the upside with good volume to keep this rally alive…
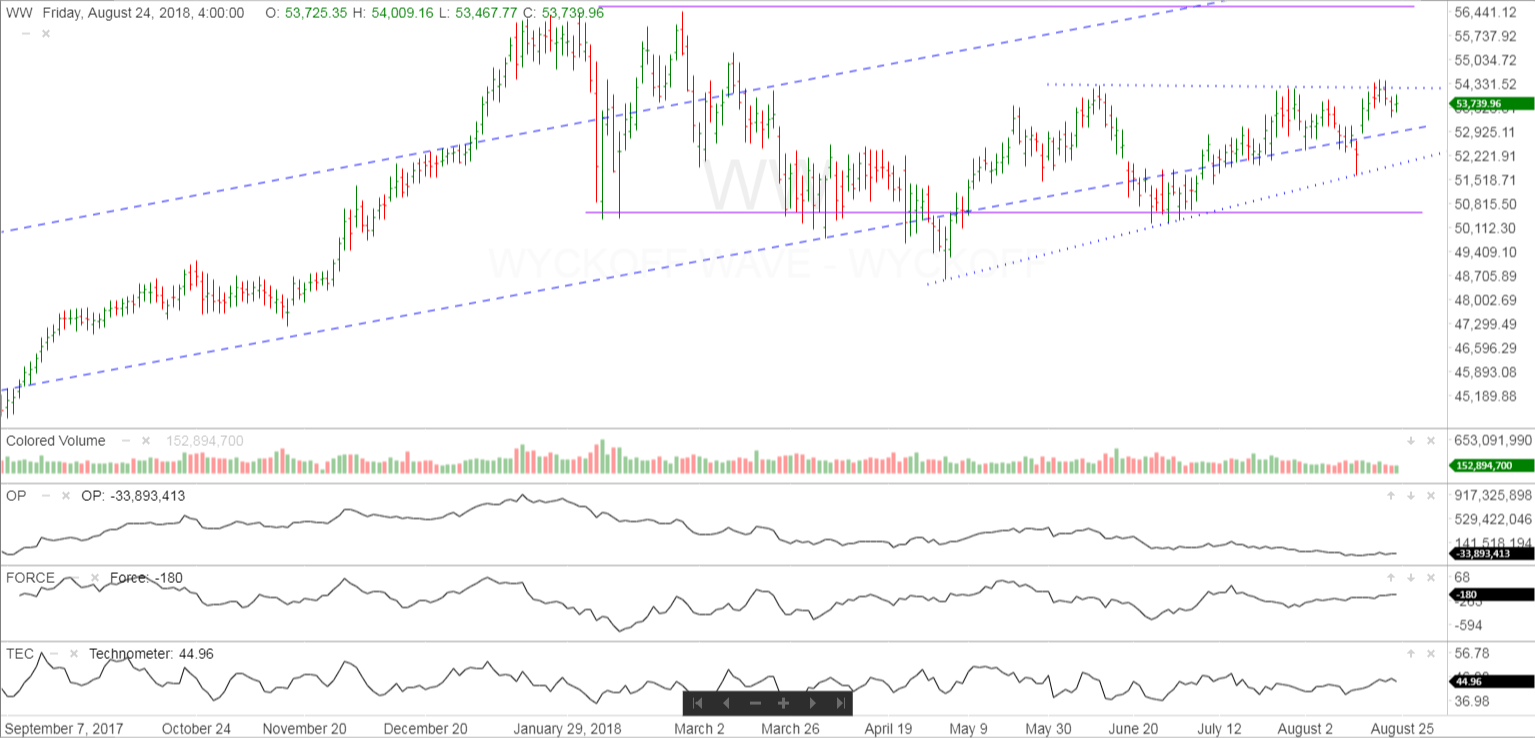
The one year daily chart shows the Wyckoff Wave trading in an uptrend on an intermediate term basis, but losing the stride of the uptrend. We are still in the middle of the short term trading range shown by the purple trendlines.
Last week we could not overcome the resistance at the 54,300 level, and pulled back slightly from it. Lets see how we act in the first few days of this week.
The Wave has had many opportunities to continue its advance, but it continues to not rally aggressively to the top of the range. This is disappointing thus far to the bulls. We need to see this type of action soon, or we could begin to rollover.
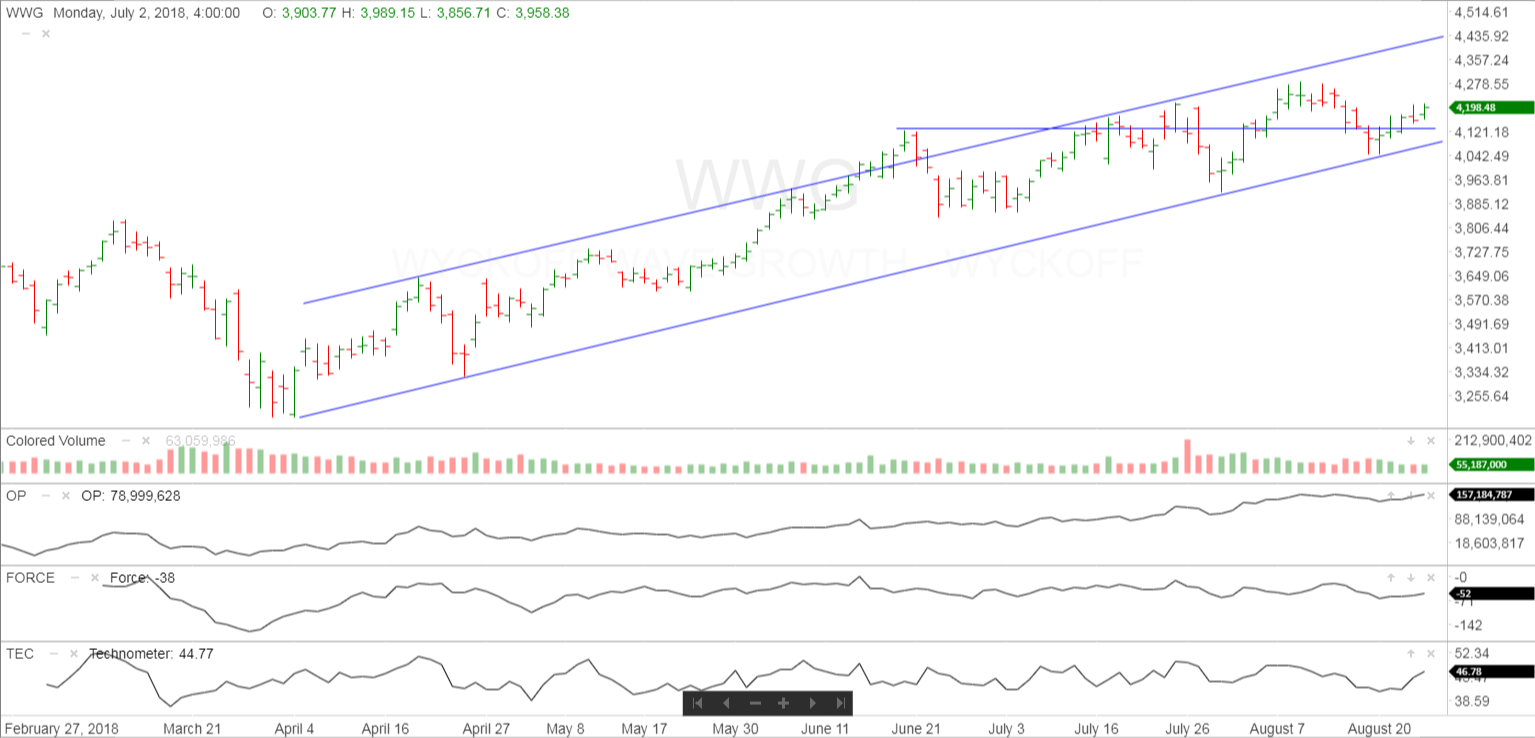
The Wyckoff Wave Growth Index (WWG) traded slightly higher for the week. The recent decline tested the support line of the recent uptrend, and slowly rallying off of it.
Its Technometer reading is nearing overbought and will reach there on any further rally. This market looks like it could be stuck in a trading range as well for the immediate future.
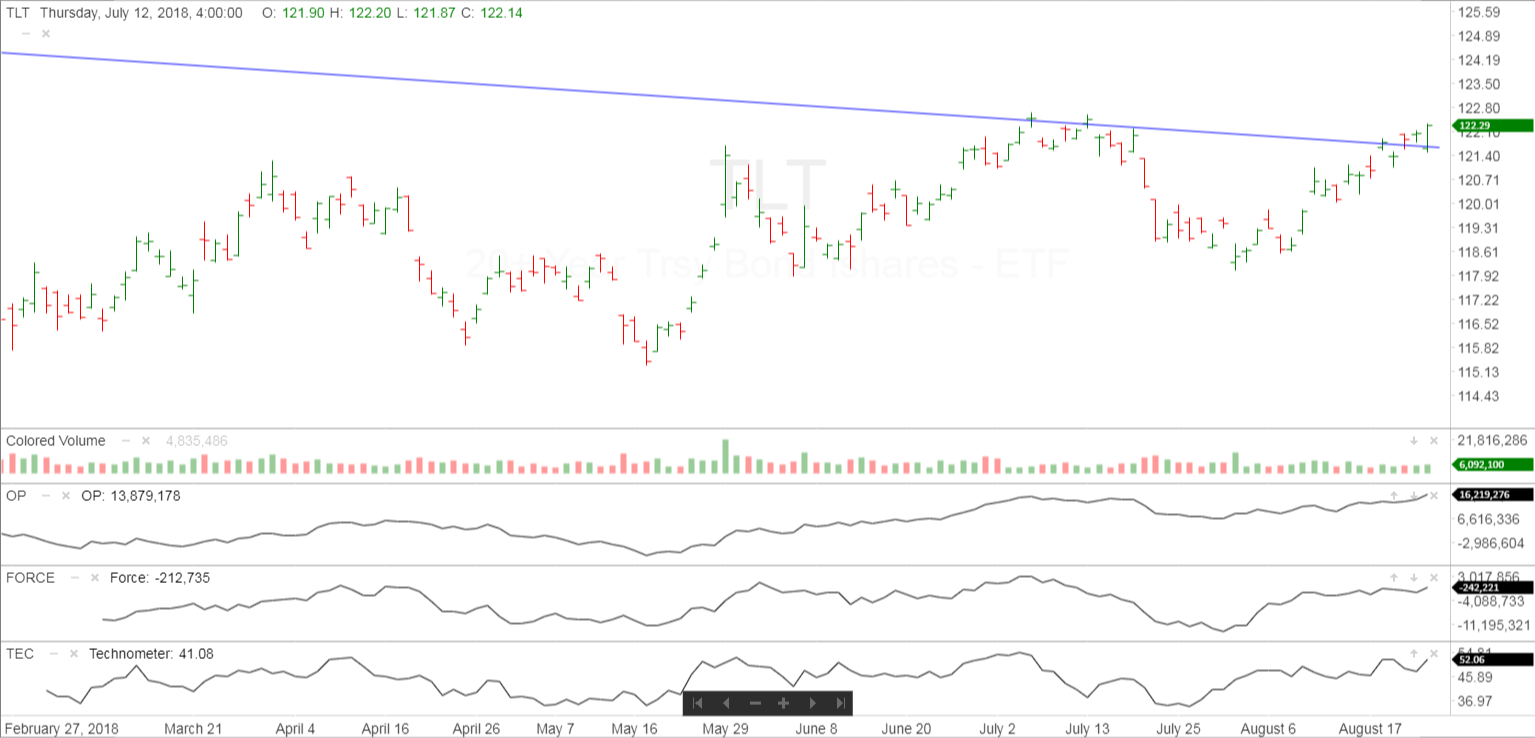
The bond market traded higher for the week once again. Volume on the recent rally has decreased and we feel it is meeting resistance and testing the previous short term highs. We are wanting to be short this market.
A month ago TLT had met resistance at its supply line of its intermediate down trend, and volume came in on the decline thereafter. We have now rallied back to the resistance level. The Technometer is overbought so short positions should be warranted soon.
IMPORTANT ANNOUNCEMENT: Our “Pulse of The Market” charting software for Cryptocurrrencies is now working. This software has consolidated volume for the Crypto’s which is utmost important when applying Wyckoff Technical Analysis. We are going to test reliability next few weeks, and then preparing to offer it to subscribers.
Due to the demand for Bitcoin/Cryptocurrency information and trading knowledge, we released a Cryptocurrency and Wyckoff Trading Course at our site, LearnCrypto.io This course is being offered at an affordable $299.99. We have had 938 students enroll since its launch on June 22, 2017. On June 28th we added lessons detailing the OP, Force, and Technometer and how to use these Wyckoff Tools for analysis.
If you are interested in Wyckoff stock chart analysis as well as Crptocurrency, search “Learn Crypto / Wyckoff SMI” or click this link https://www.youtube.com/channel/UCDxK2PwEDvoaHZgjPV_WgcA
Please subscribe and click the bell to be notified of our upcoming broadcasts.
Our current schedule is Monday-Thursday approximately 6:30 p.m. CST, and they usually last approximately one hour. We will also broadcast at additional random times since we want to satisfy our international subscribers as well.
If you would also like to follow us on twitter for news and trade ideas, follow “LearnCryptoShow”, or “WyckoffonCrypto”. We have given numerous profitable trades to our subscribers on the Youtube channel, as well as Twitter.
Good Trading,
Todd Butterfield

Responses