The Wyckoff Wave traded sideways for the week….
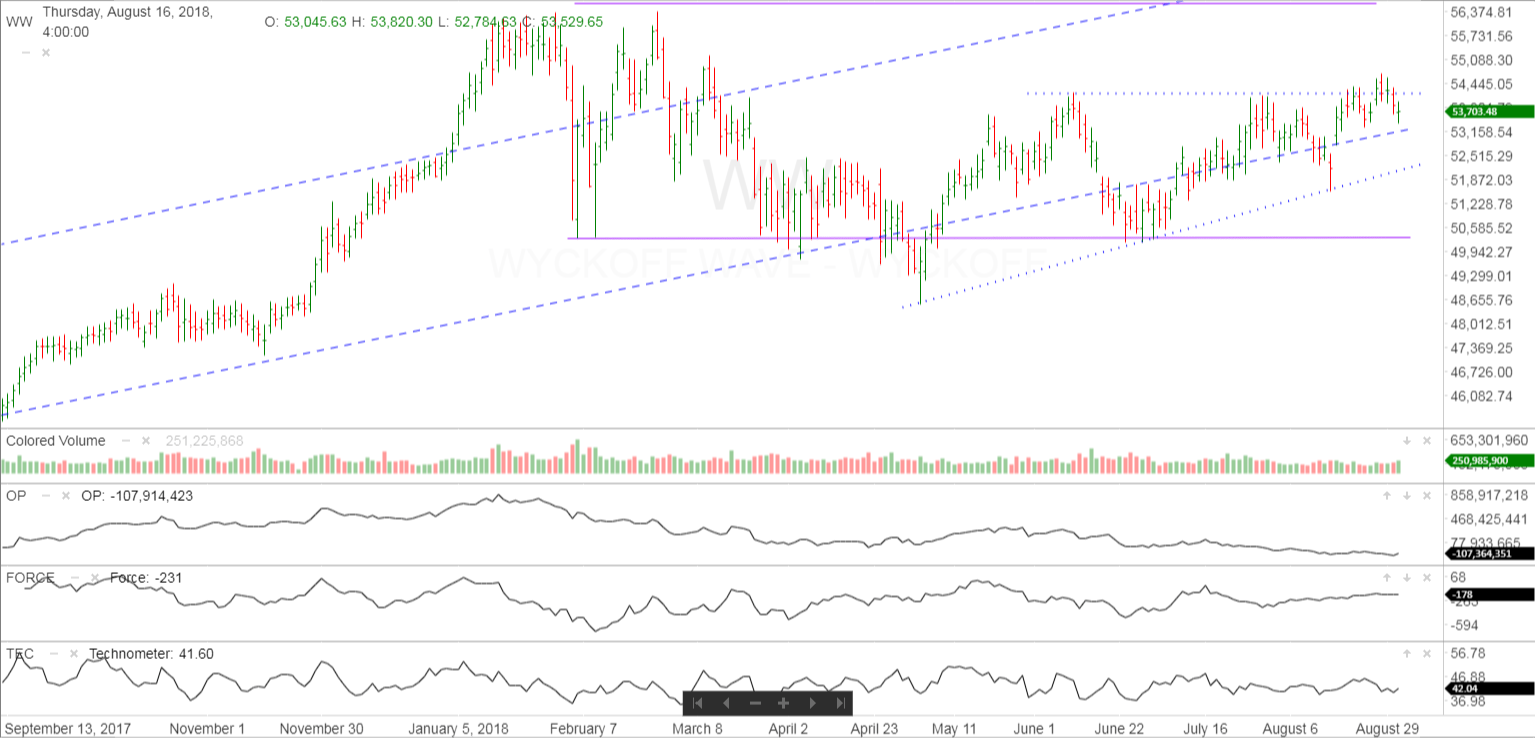
The Wyckoff Wave traded once again flat for the week. Volume still trading at slightly lower levels.
The O-P is a broken record and continues to trade very sluggish, and not rallying off the lows.
The Force Index was unchanged for the week.
The Technometer closed the week slightly below neutral.
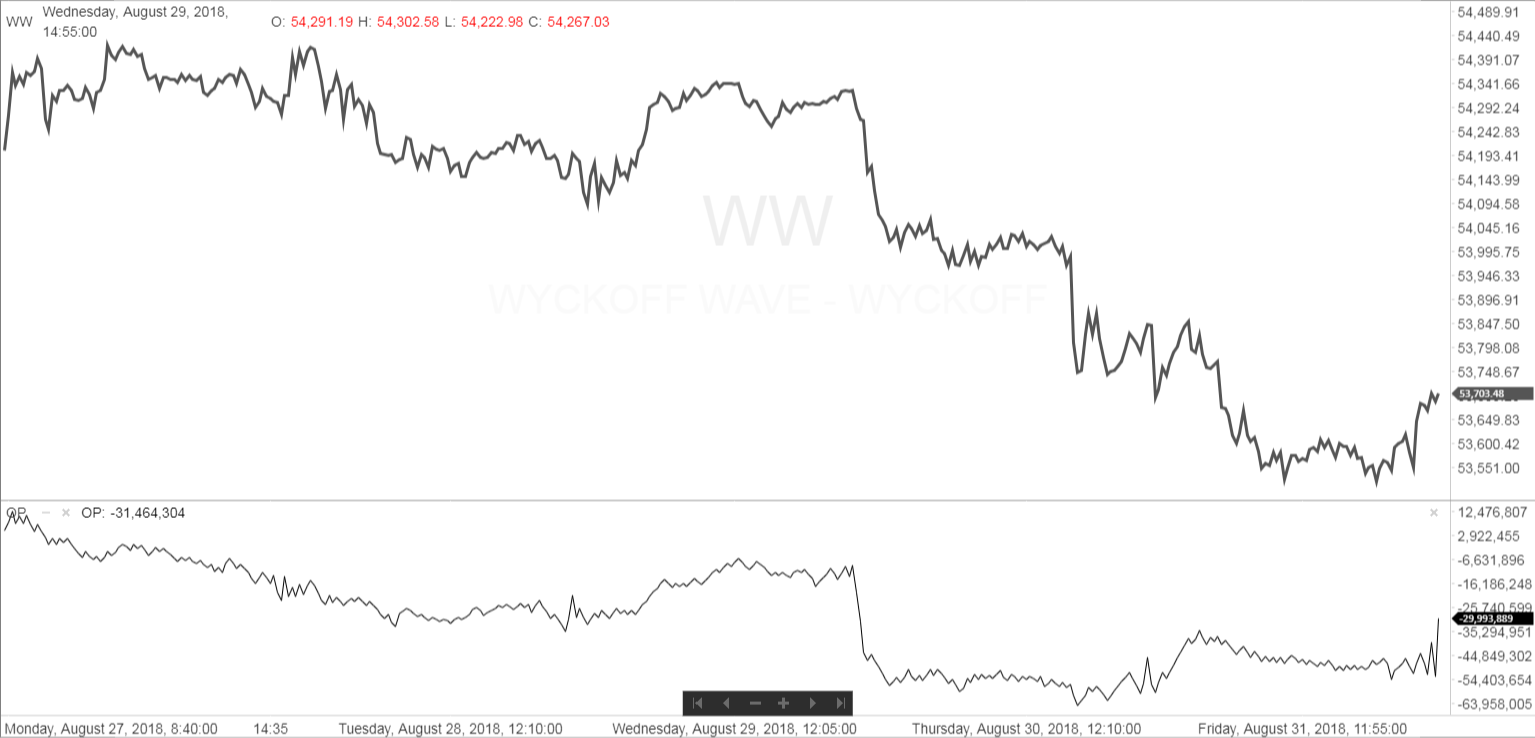
The intraday chart for last week showed the OP leading the way lower, before having a slight positive divergence on Friday. Thus far it has not rallied in unison with the Wave which is a worrisome sign. The OP will need to expand to the upside with good volume to get the Wyckof Wave to rally stronger to the upside.
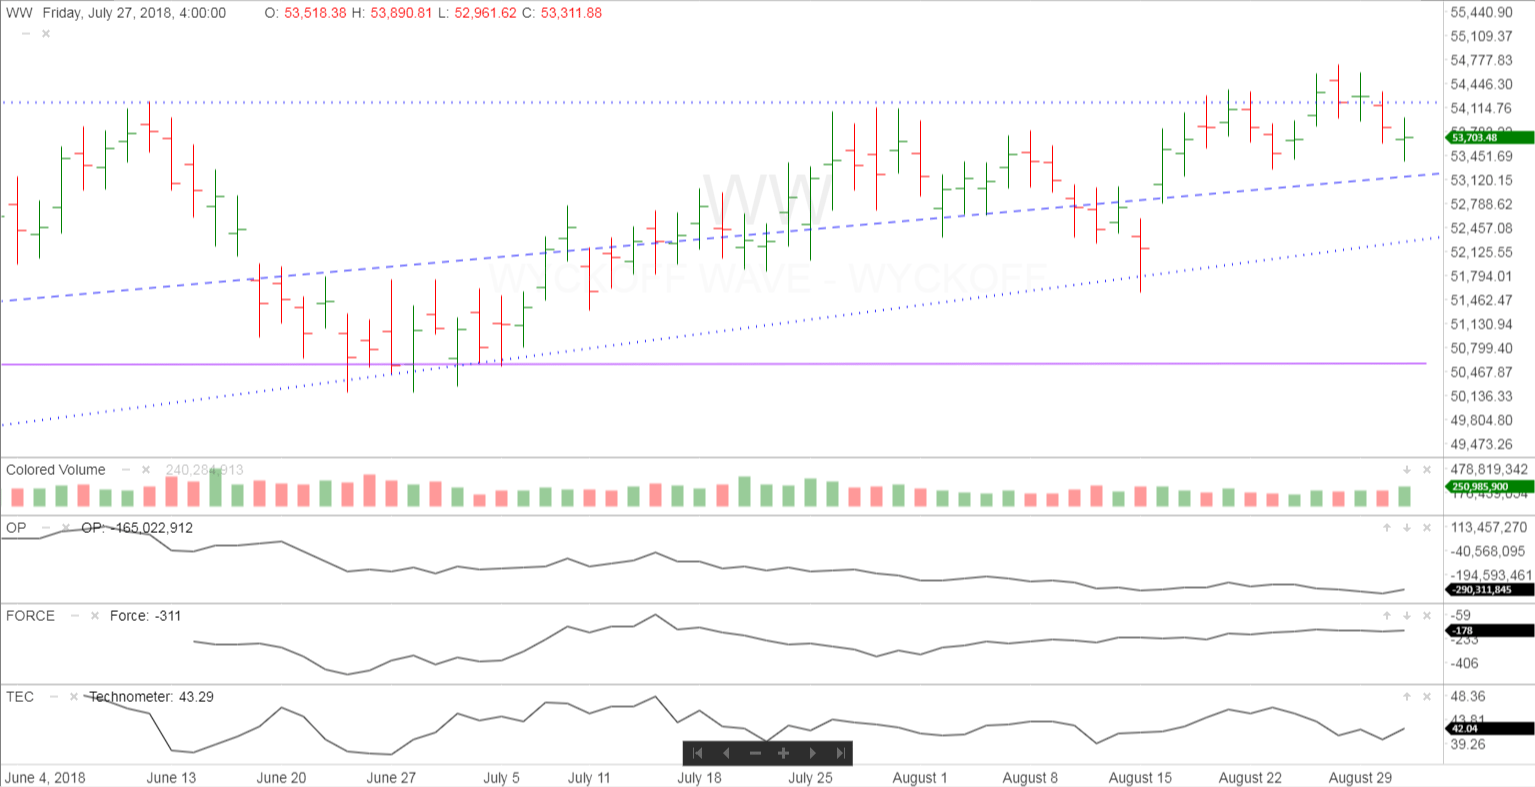
The one year daily chart shows the Wyckoff Wave trading in an uptrend on an intermediate term basis, but losing the stride of the uptrend. We are still in the middle of the short term trading range shown by the purple trendlines. The action is starting to look like Robert Evan’s “Shell Hunter’s Tragedy”, where the uptrend is lost to a trading range and distribution.
Last week we could not overcome the resistance at the 54,300 level, and pulled back slightly from it. We continue to falter at this important level.
The Wave has had many opportunities to continue its advance, but it continues to not rally aggressively to the top of the range. This is disappointing thus far to the bulls. We need to see this type of action soon, or we could begin to rollover.
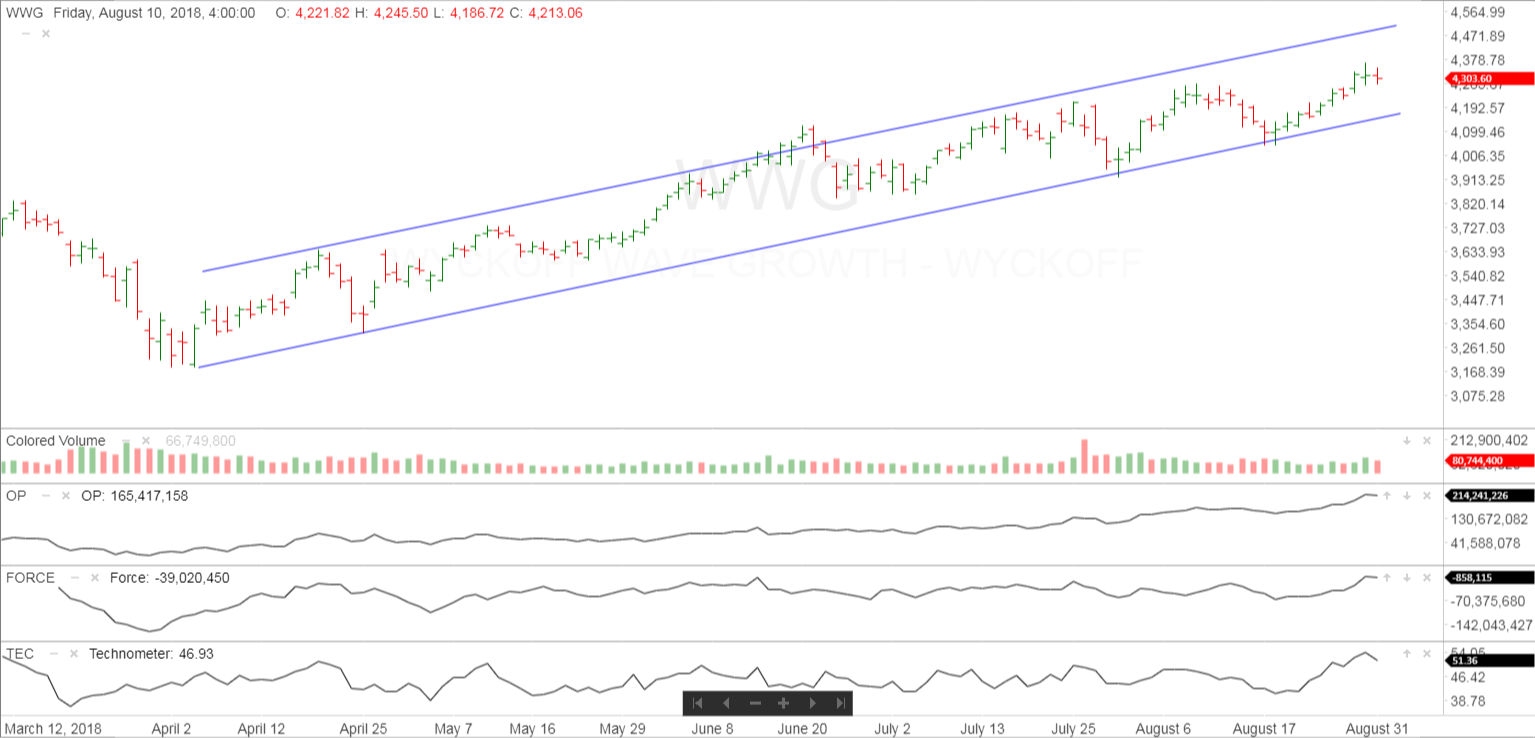
The Wyckoff Wave Growth Index (WWG) traded higher for the week. We continue within the well defined uptrend and now in the middle of that trend.
Its Technometer reading is overbought which we expected on the continued rally. It is actually more overbought then it has been in other area of the uptrend. It is not far from the support line of its uptrend so it will be interesting how it responds when it approaches it.
Those of you who are aggressive could attempt a short position here with a close stop.
The bond market traded slightly lower for the week. Volume on the recent rally has decreased and we feel it is meeting resistance and testing the previous short term highs. We were wanting to be short this market and one could be taken with a stop at the most recent high. Friday’s action appears to be a successful test of the high last Friday.

IMPORTANT ANNOUNCEMENT: Our “Pulse of The Market” charting software for Cryptocurrrencies is now working. This software has consolidated volume for the Crypto’s which is utmost important when applying Wyckoff Technical Analysis. We are showing this software in use on our social media sites.
Due to the demand for Bitcoin/Cryptocurrency information and trading knowledge, we released a Cryptocurrency and Wyckoff Trading Course at our site, LearnCrypto.io This course is being offered at an affordable $299.99. We have had 940 students enroll since its launch on June 22, 2017. On June 28th we added lessons detailing the OP, Force, and Technometer and how to use these Wyckoff Tools for analysis.
If you are interested in Wyckoff stock chart analysis as well as Crptocurrency, search “Learn Crypto / Wyckoff SMI” or click this link https://www.youtube.com/channel/UCDxK2PwEDvoaHZgjPV_WgcA
Please subscribe and click the bell to be notified of our upcoming broadcasts.
Our current schedule is Monday-Thursday approximately 6:30 p.m. CST, and they usually last approximately one hour. We will also broadcast at additional random times since we want to satisfy our international subscribers as well.
If you would also like to follow us on twitter for news and trade ideas, follow “LearnCryptoShow”, or “WyckoffonCrypto”. We have given numerous profitable trades to our subscribers on the Youtube channel, as well as Twitter.
Good Trading,
Todd Butterfield

Responses