We want to enter a short position in TLT at the market.
TLT (20 Yr. Treasury Bond ETF) is currently trading at $139.13. It has been in a downtrend for the last 8 trading sessions, and has just experience a two day bounce. Quickly our Wyckoff Technometer has came back to an almost overbought reading at 49 which is marked with the blue circle on chart #1.
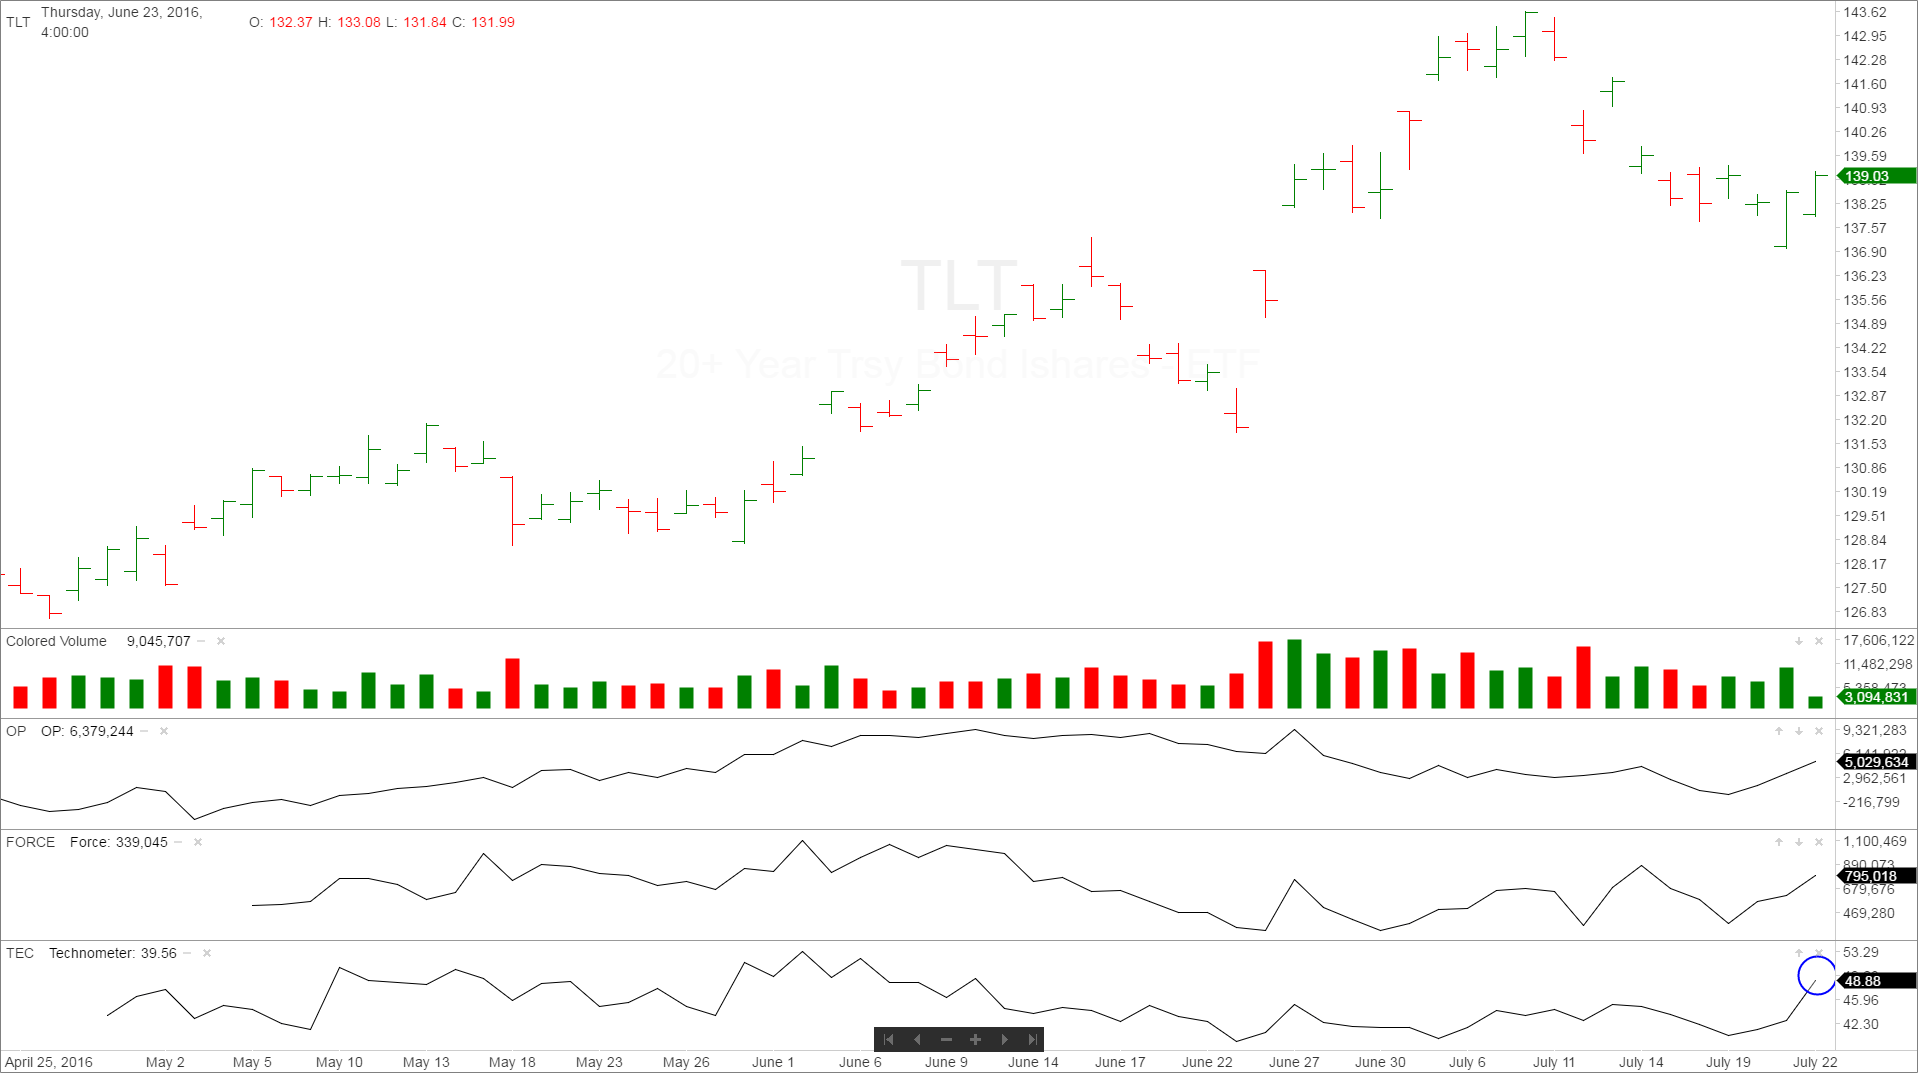
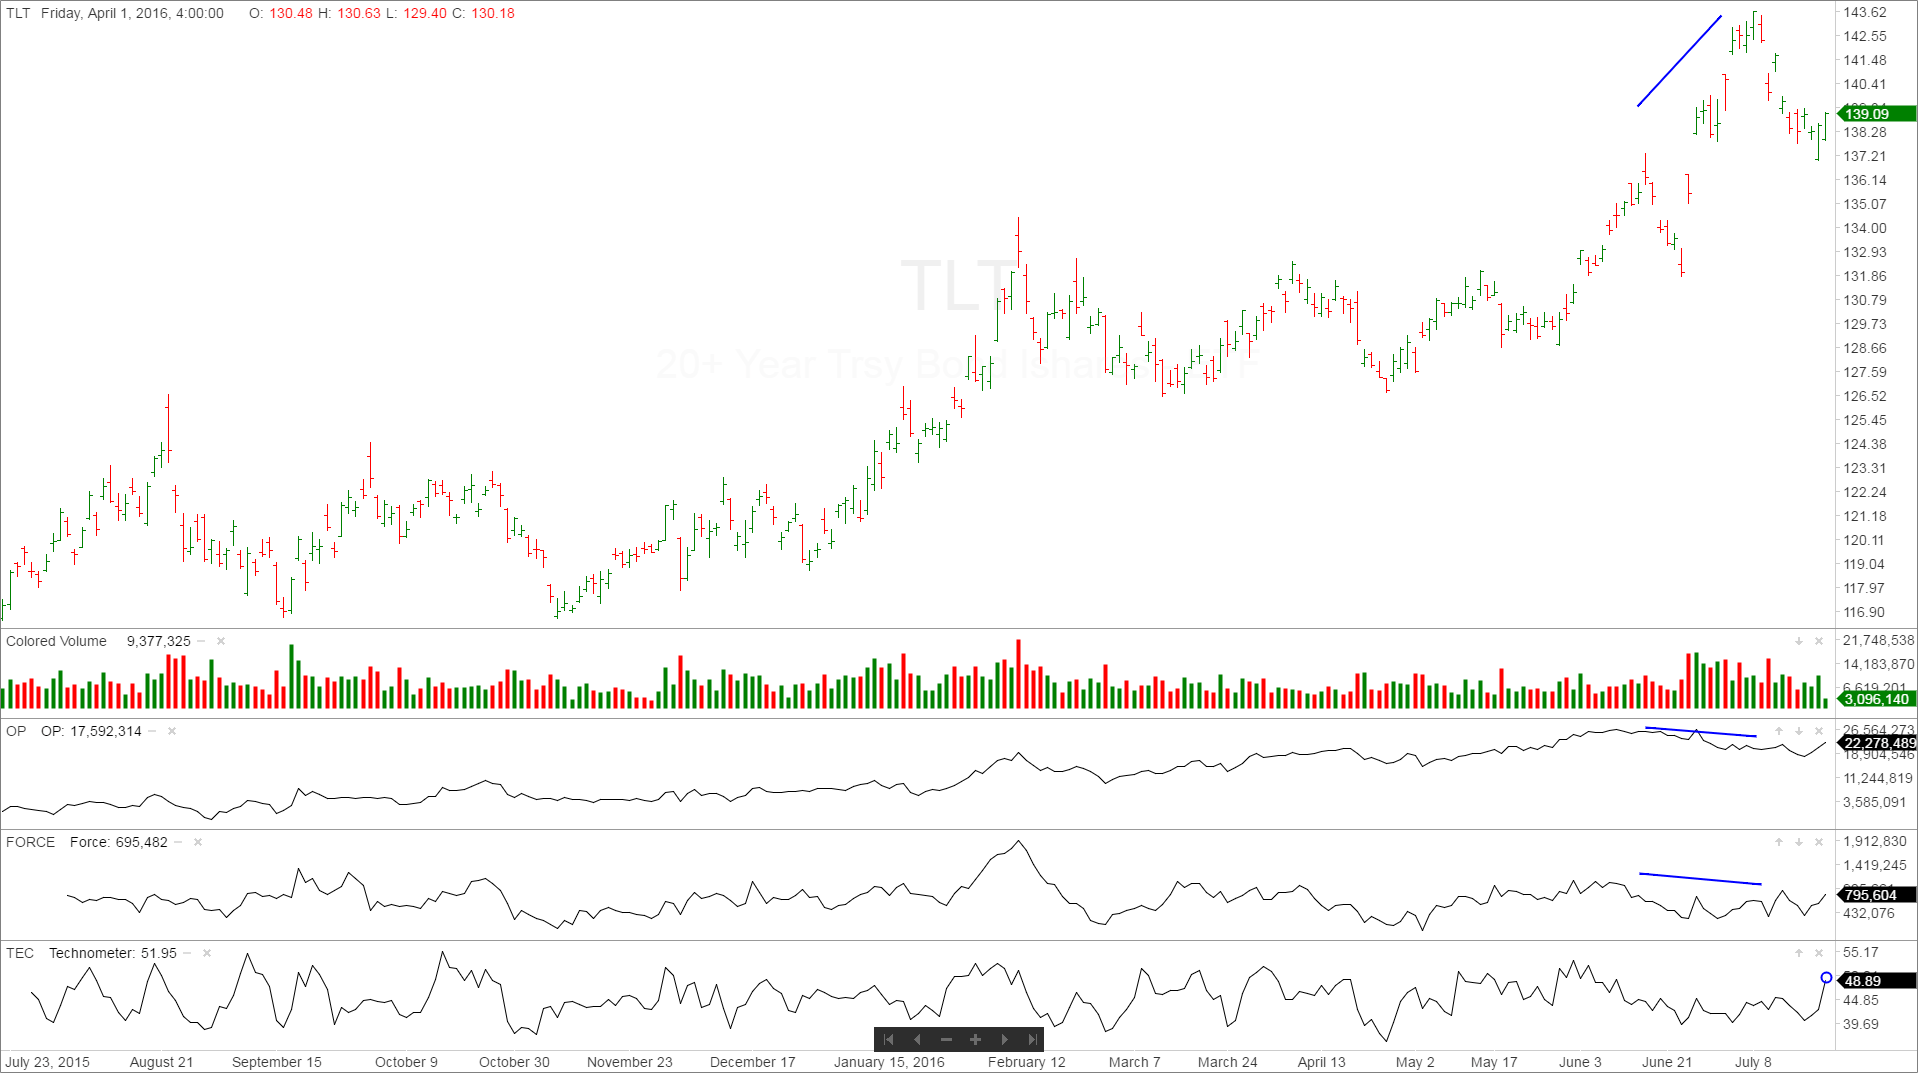
Chart #2 is a one year chart, and you can see the most recent rally into the July top, there was a divergence between the Price and the OP and Force. Price made a new high, and OP and Force lagged behind considerably. This appear to show the rally was suspect.
Because of the above observations, we think there is more downside to the recent selloff from these levels. Go short at the market…
Responses