Wyckoff Wave At Support, And Looking To Bounce.
The Wyckoff Wave was down every day this past week. Volume is still at low levels.
The O-P was down for the week.
The Force Index was down for the week.
We have been looking for continued sideways action in our recent trading range, and we have gotten it. We have now worked our way down to the support line of the trading range.
The Technometer is now at 37.7, so once again we expect the support to hold and rally back to the middle of the trading range.
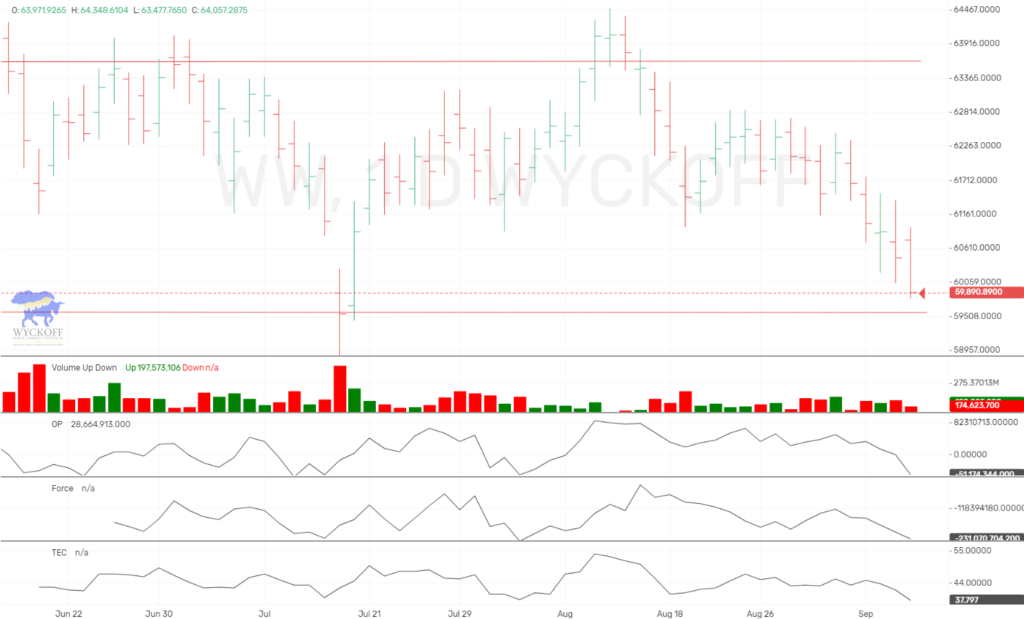
The Wave and OP are trading in harmony.
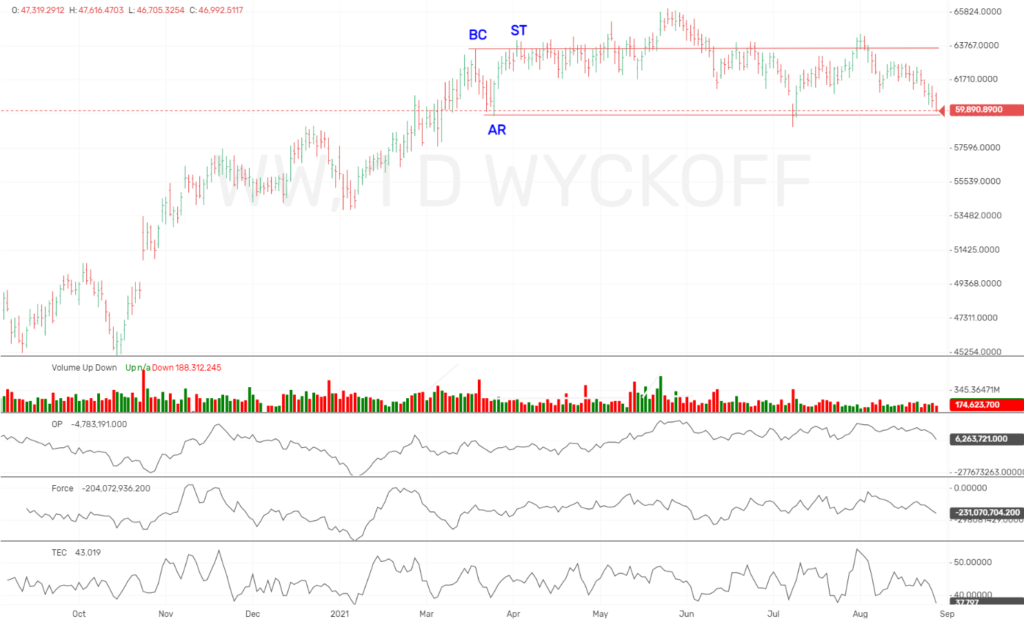
In the larger picture for the Wyckoff Wave, we continue to see range bound trading. For the time being, it appears we can expect still more until we get ending action.
The Technometer is oversold as we near the support of the trading range as marked by the AR (Automatic Reaction).
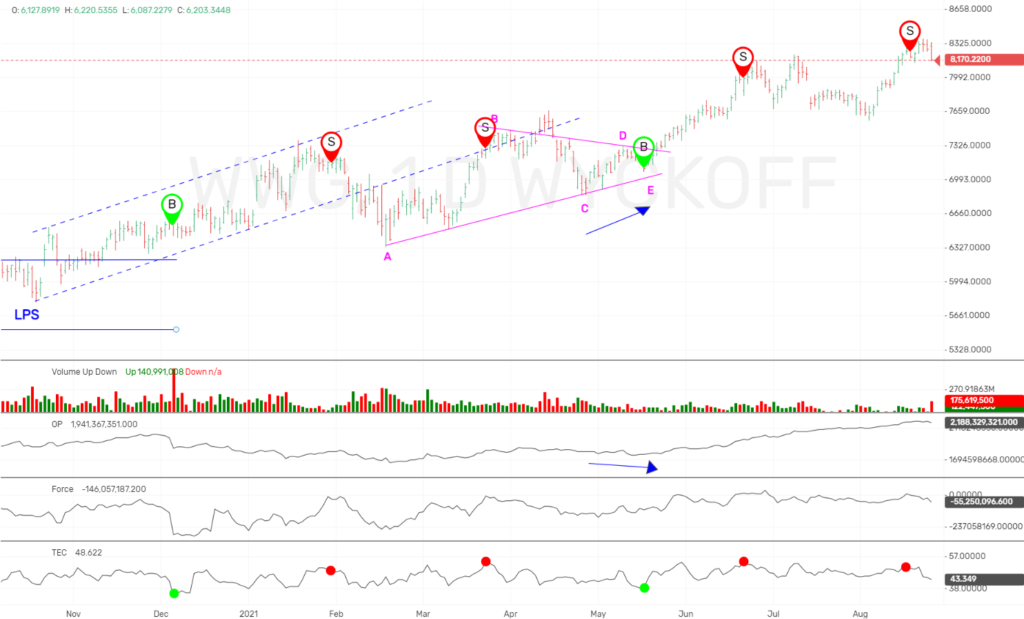
The Wyckoff Wave Growth Index (WWG) finished the week on a sour note. Mostly sideways action, until the Friday selloff, with higher volume accompanying it.
We are still on the sidelines here looking for lower.
Technometer is neutral, so we expect this market to try the downside a little more before recommending buying.
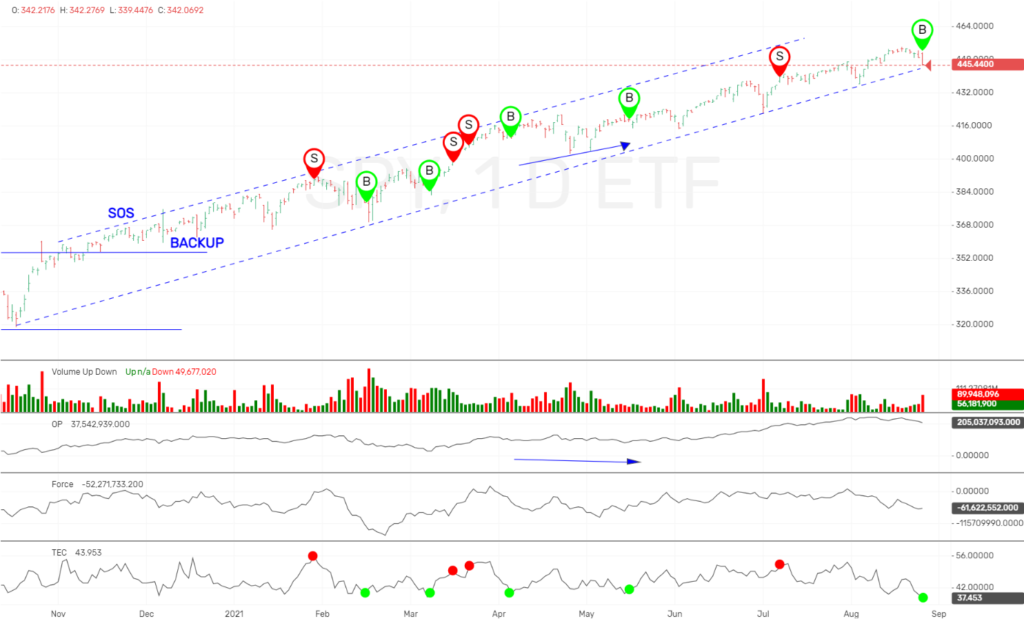
The SPY finished the week lower every day as well. On the SPY, we have been looking for a correction but it has been slow starting.
You can see the uptrend channel looks tired, as prices have continued to not have the strength to rally to the overbought line of that uptrend. This looks bearish…. But the SPY continues to respect the blue uptrend line like clockwork, and will encounter that support this week.
The Technometer is registering oversold, so it looks like the support line could possibly hold us once again. We will watch early in the week, to see if it does hold, and trade accordingly.
If you want more current up to the minute updates and trades as shown above, please join our ProTraders/Private Stock Discord. Join Here
If you are a Crypto Discord Member, and would like the ProTraders/Private Stock Discord as well, you can have access for only $20 a month. Join Here
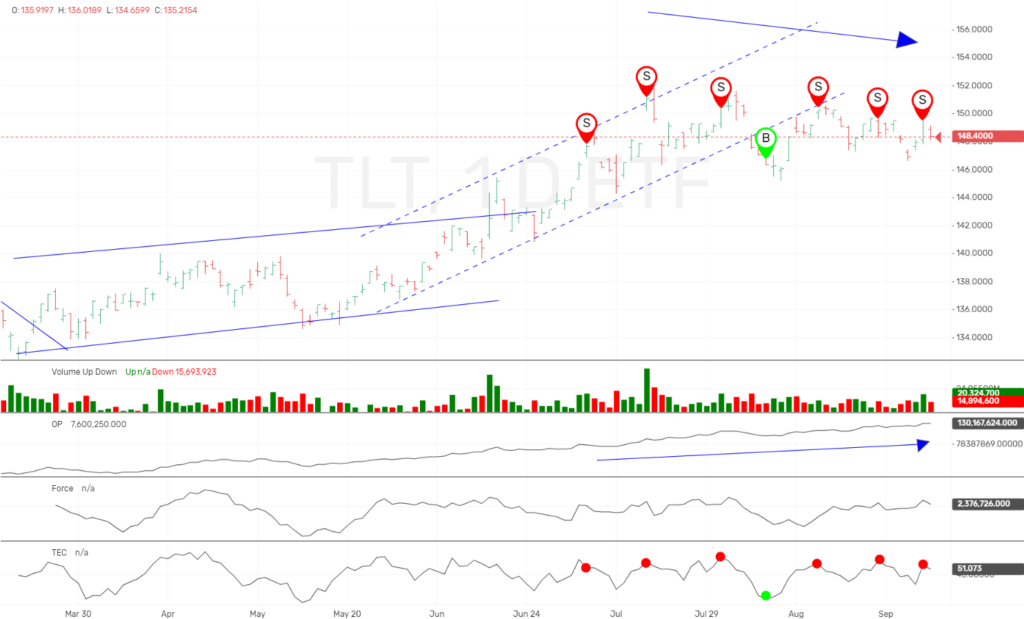
The bond market was down for the week as expected, and continues to trade net sideways.
Our Technometer is still at an overbought reading after Thursday’s surge, so we expect more weakness in the week ahead. The OP closed at a recovery high on Thursday, while price did not once again. This coupled with the overbought Technometer looks extremely bearish.
We are short and looking for a breakdown.
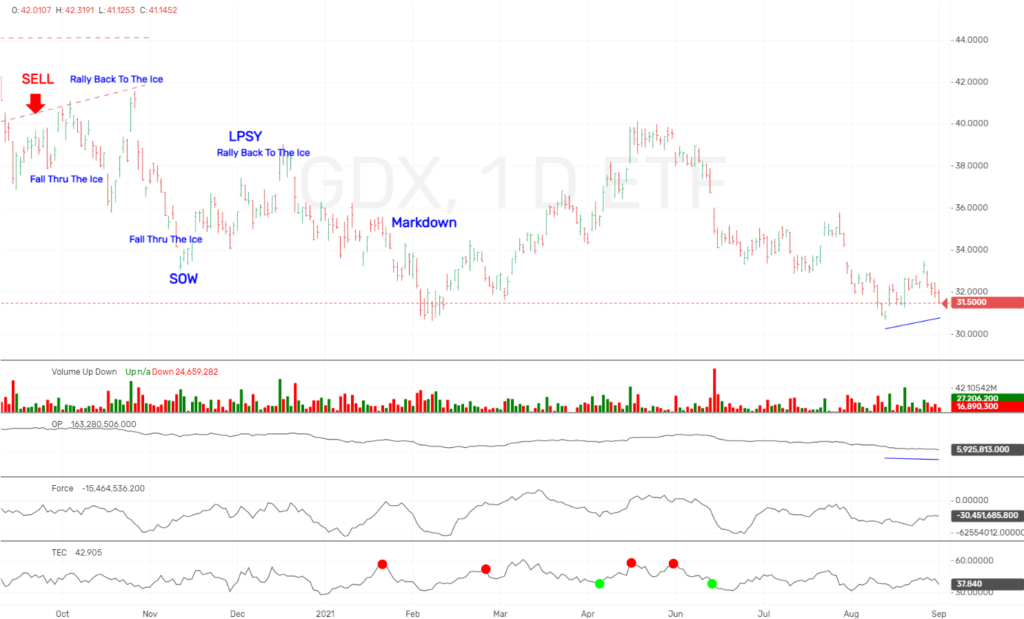
The GDX finished the week lower.
Technometer is still near oversold, and we have the OP hitting a new low in the last three weeks, while price holds, this is short term bullish.
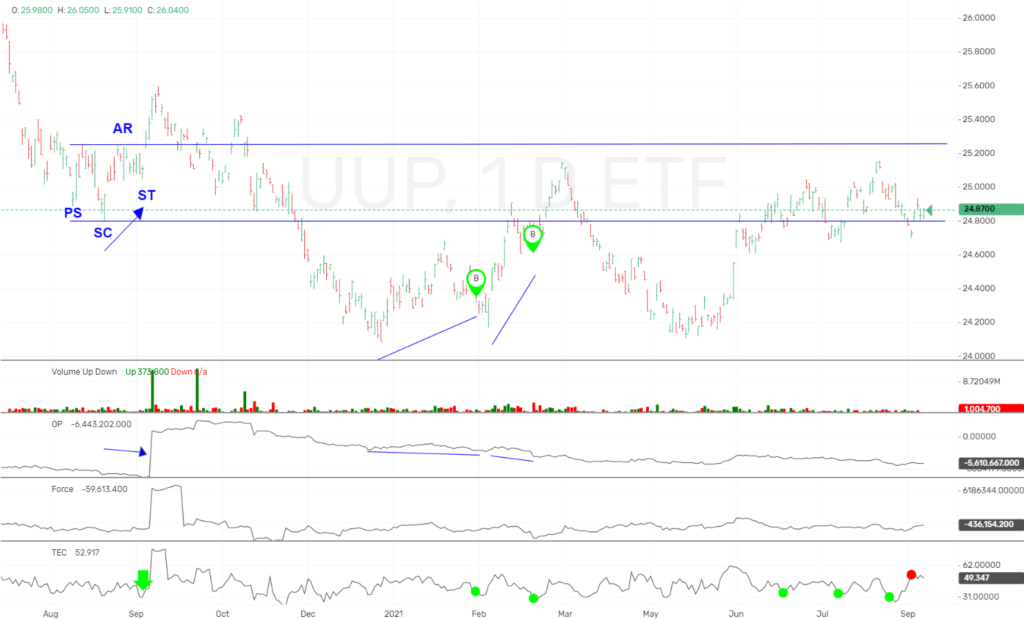
The long dollar ETF, UUP was up slightly for the week.
The Technometer was overbought last week, and still near those levels.
We think this market will turn lower sometime this week, and look to move below $24.
IMPORTANT ANNOUNCEMENT:
We have just released a lower cost version of our Unleashed Course, which is an excellent value at $349.99. Click Here
Our new “Pulse of The Market” charting software for Cryptocurrrencies is now showing consolidated volume from over 140+ exchanges. This is utmost important when applying Wyckoff Technical Analysis. We are showing this software in use on our social media sites, and will be launching for subscription in near future.
We have an active Discord channel where we discuss the Crypto markets. We have had huge success and if you trade Bitcoin you might like monthly access at $40 a month. Join Here
Due to the demand for Bitcoin/Cryptocurrency information and trading knowledge, we released a Cryptocurrency and Wyckoff Trading Course at our site, LearnCrypto.io This course is being offered at an affordable $299.99. We have had 1027 students enroll since its launch on June 22, 2017. On June 28th, 2018 we added lessons detailing the OP, Force, and Technometer and how to use these Wyckoff Tools for analysis.
If you are interested in Wyckoff stock chart analysis as well as Cryptocurrency, search “Learn Crypto / Wyckoff SMI” or click this link https://www.youtube.com/channel/UCDxK2PwEDvoaHZgjPV_WgcA
Please subscribe and click the bell to be notified of our upcoming broadcasts.
If you would also like to follow us on twitter for news and trade ideas, follow “WyckoffonStocks”, “LearnCryptoShow”, or “WyckoffonCrypto”. We have given numerous profitable trades to our subscribers on the Youtube channel, as well as Twitter.
Good Trading,
Todd Butterfield
Responses