Wyckoff Wave At Support, Not Bouncing.
The Wyckoff Wave was down again for the week. Volume increased.
The O-P was down slightly for the week.
The Force Index was down for the week.
We have been looking for continued sideways action in our recent trading range. We now find ourselves at the support of the range, and we are not rallying off of it. Last week’s action does not look good for the bulls.
The Technometer is now at a neutral 43.7, so we could trade in any direction from here.
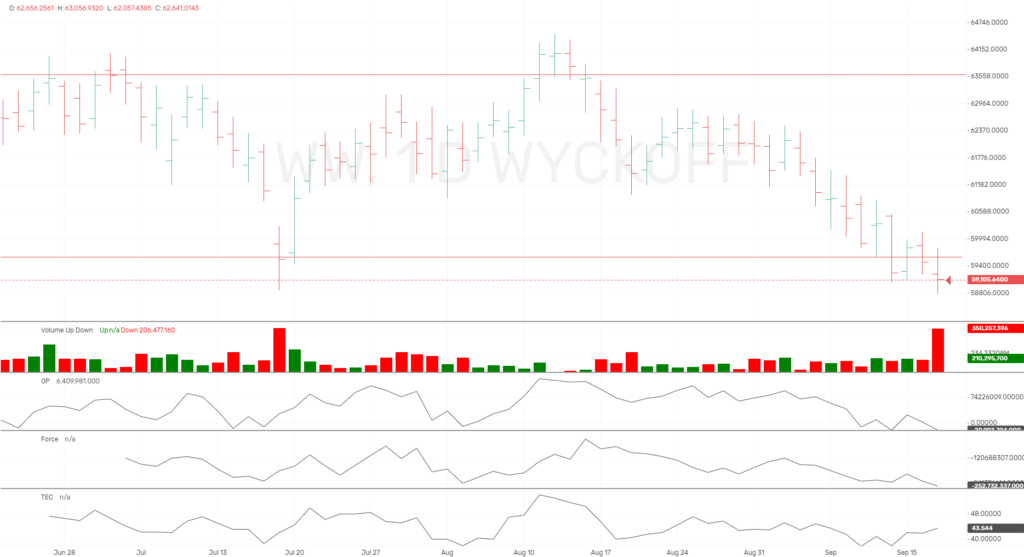
Last week the Wyckoff Wave traded weaker than the OP. This is not bullish action.
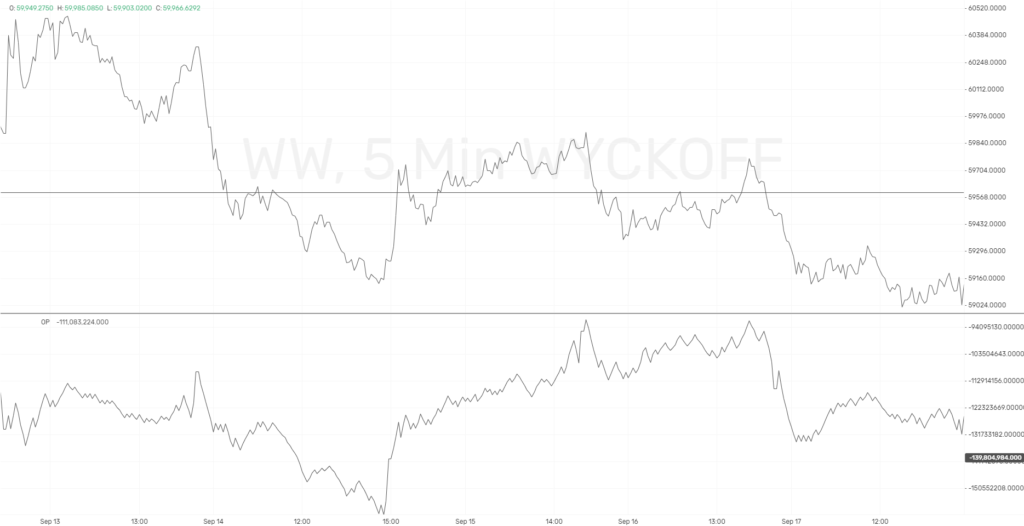
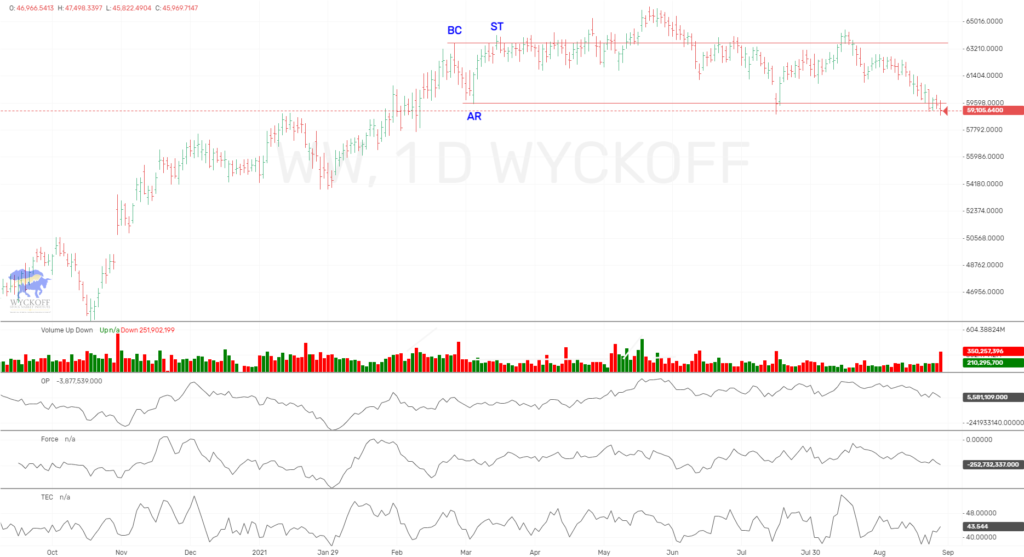
In the larger picture for the Wyckoff Wave, we continue to see range bound trading. But we are threatening to break the support and start a markdown phase. The next few months are historically not good for positive returns.
The Technometer has came off of oversold and now at a neutral 43.7. If we get overbought soon, we will be look at shorting opportunities.
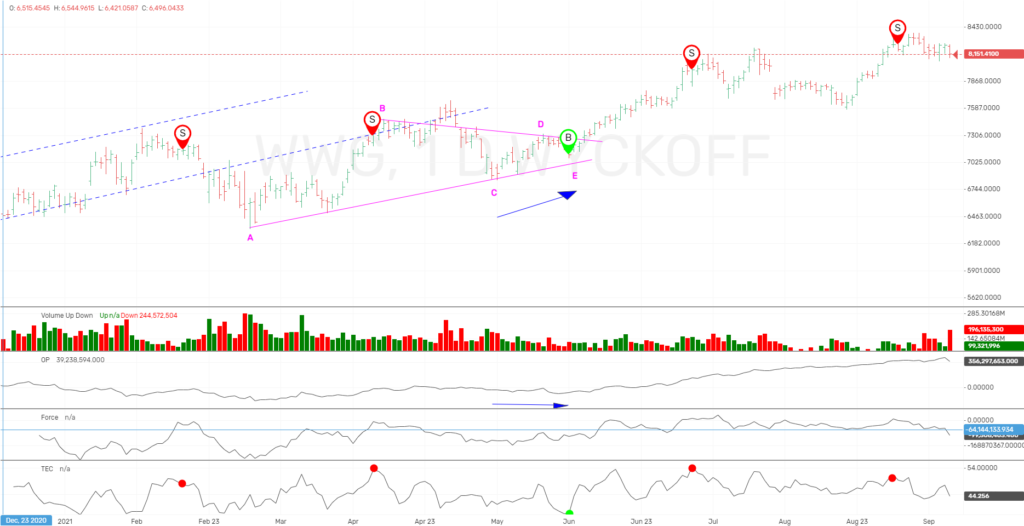
The Wyckoff Wave Growth Index (WWG) finished the week down slightly. Mostly sideways action, with a weak close on friday, with higher volume accompanying the selling.
We are still on the sidelines here looking for lower.
Technometer is still neutral, so we expect this market to try the downside a little more before recommending buying.
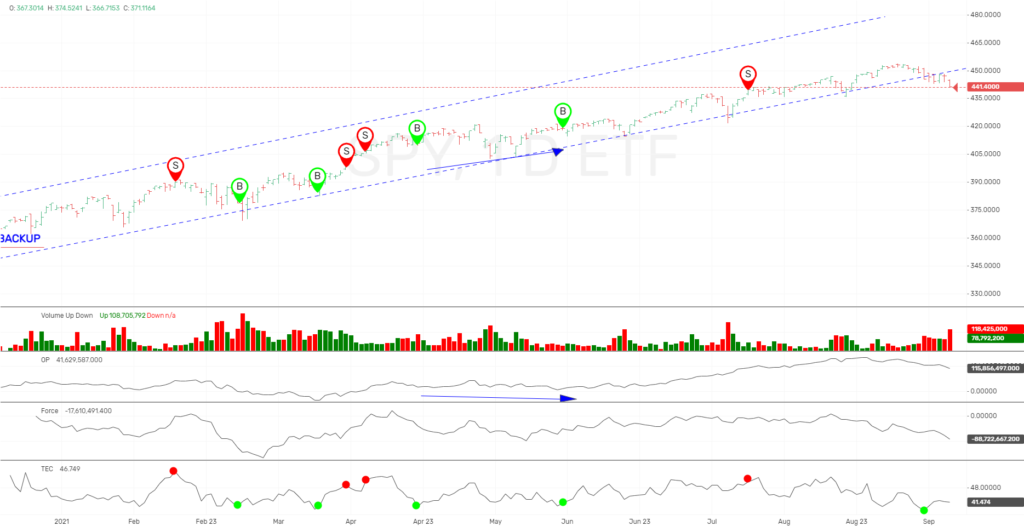
The SPY finished the week lower as well, and finally broke its blue uptrend.
We had spoke of the uptrend channel looking tired, as prices did not have the strength to rally to the overbought line of that uptrend. We have now solidly broke that uptrend with Friday’s weak close, and increased volume for the week.
The Technometer was oversold, and this did not help us respect the support line of the uptrend, and this is bearish action. Luckily we had waited to recommending buying, even though the Technometer was oversold. Now, it is 41.5, and we are continuing to stay on the sidelines.
If you want more current up to the minute updates and trades as shown above, please join our ProTraders/Private Stock Discord. Join Here
If you are a Crypto Discord Member, and would like the ProTraders/Private Stock Discord as well, you can have access for only $20 a month. Join Here
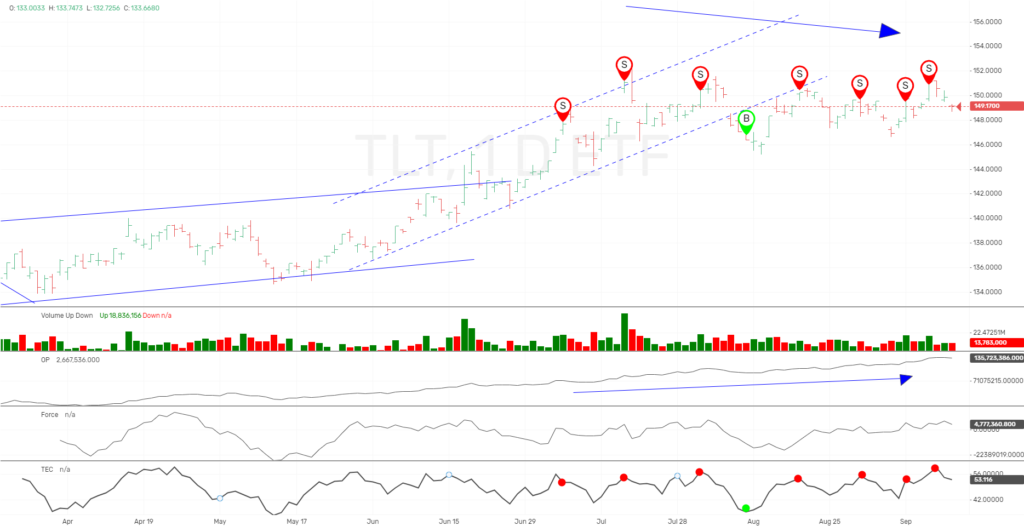
The bond market was down for the week as expected, and continues to trade net sideways.
We had a quick rally on Tuesday, which took us out of our short position for a small loss. That rally took the Technometer to an extreme overbought reading of 58.7.
The negative divergence between price and OP, continues, and all these indications look extreme bearish.
We are looking for lower prices…..
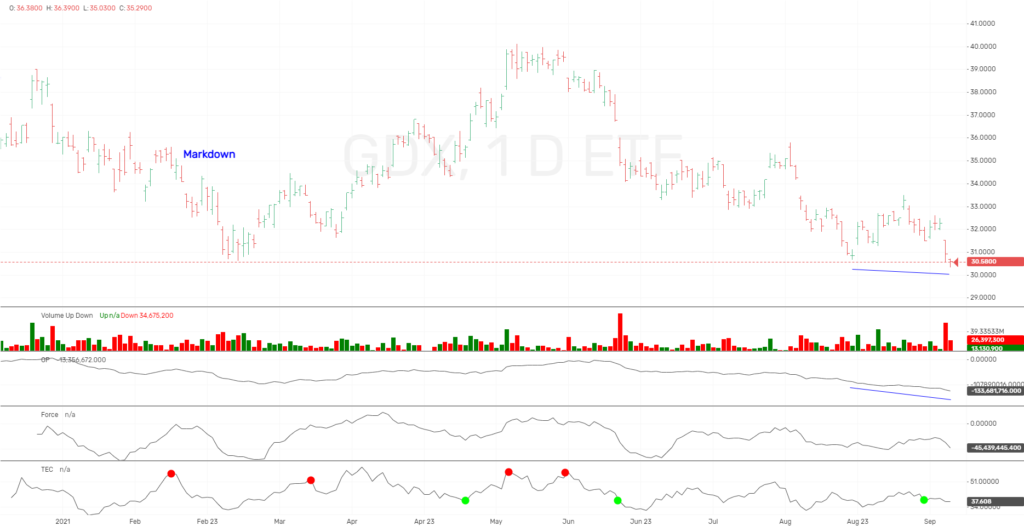
The GDX finished the week lower, against our short term bullishness.
Technometer is still near oversold, and we have slight inharmonious action between the GDX and OP. We still expect this market to make a low in the coming days and try the upside again.
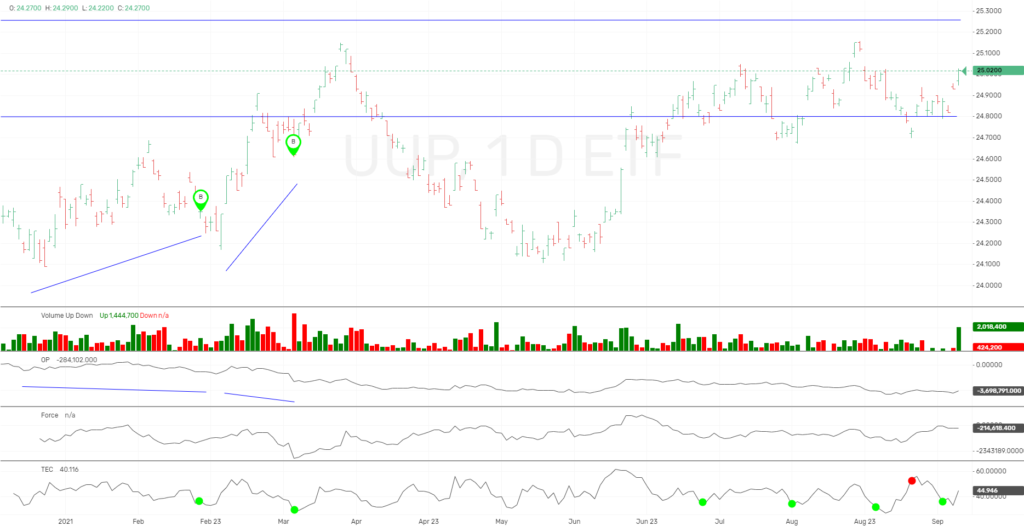
The long dollar ETF, UUP was up for the week.
The Technometer went to oversold on Tuesday and gave us the strong finish to the upside for the week. We will be on the sidelines until the Technometer registers overbought.
IMPORTANT ANNOUNCEMENT:
We have just released a lower cost version of our Unleashed Course, which is an excellent value at $349.99. Click Here
Our new “Pulse of The Market” charting software for Cryptocurrrencies is now showing consolidated volume from over 140+ exchanges. This is utmost important when applying Wyckoff Technical Analysis. We are showing this software in use on our social media sites, and will be launching for subscription in near future.
We have an active Discord channel where we discuss the Crypto markets. We have had huge success and if you trade Bitcoin you might like monthly access at $40 a month. Join Here
Due to the demand for Bitcoin/Cryptocurrency information and trading knowledge, we released a Cryptocurrency and Wyckoff Trading Course at our site, LearnCrypto.io This course is being offered at an affordable $299.99. We have had 1027 students enroll since its launch on June 22, 2017. On June 28th, 2018 we added lessons detailing the OP, Force, and Technometer and how to use these Wyckoff Tools for analysis.
If you are interested in Wyckoff stock chart analysis as well as Cryptocurrency, search “Learn Crypto / Wyckoff SMI” or click this link https://www.youtube.com/channel/UCDxK2PwEDvoaHZgjPV_WgcA
Please subscribe and click the bell to be notified of our upcoming broadcasts.
If you would also like to follow us on twitter for news and trade ideas, follow “WyckoffonStocks“, “LearnCryptoShow”, or “WyckoffonCrypto”. We have given numerous profitable trades to our subscribers on the Youtube channel, as well as Twitter.
Good Trading,
Todd Butterfield

Responses