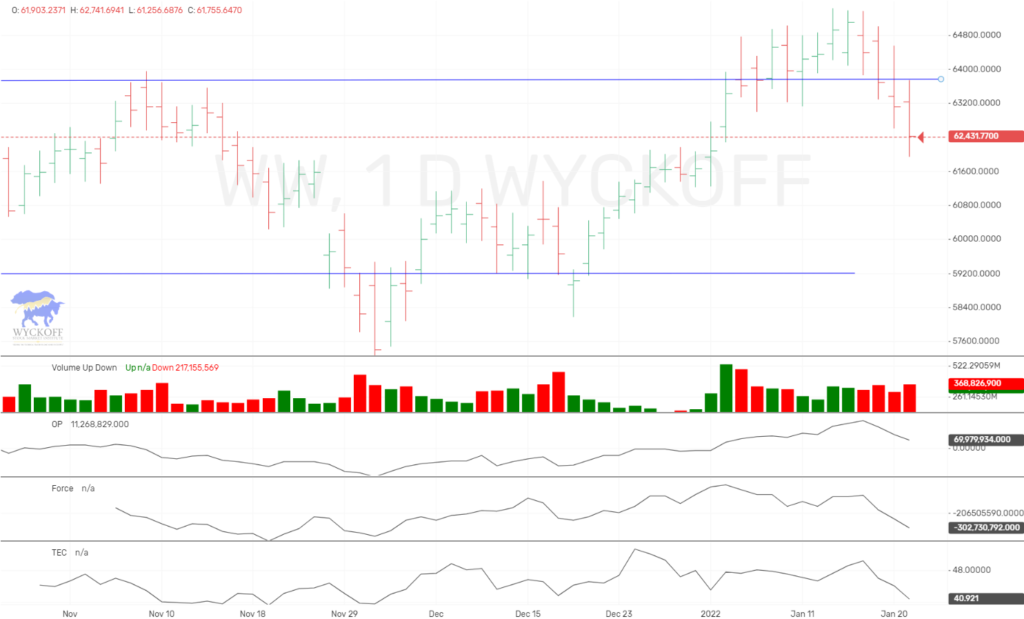
Wyckoff Wave “Backing Up” For A “Last Point Of Support”?
The Wyckoff Wave traded sharply lower for the holiday shortened week. Volume was near average.
We had mentioned that we would like the Wyckoff Wave to extend its rally somewhat, then have a “backup” to its previous resistance, with an oversold Technometer. We did not extend the rally but fell back into the trading range. It doesn’t look like a normal “upthrust”, and it looks more like a “last point of support”. We do have a Technometer nearing oversold with a reading of 40.92.
I would expect an oversold Technometer on any follow through selling on Monday. We will then look for Wyckoff Wave type stocks to try to find a bottom. These would be more Dow Jones type stocks or the individuals ones that make up the Wave.
Technometer is near oversold at a reading of 40.92.
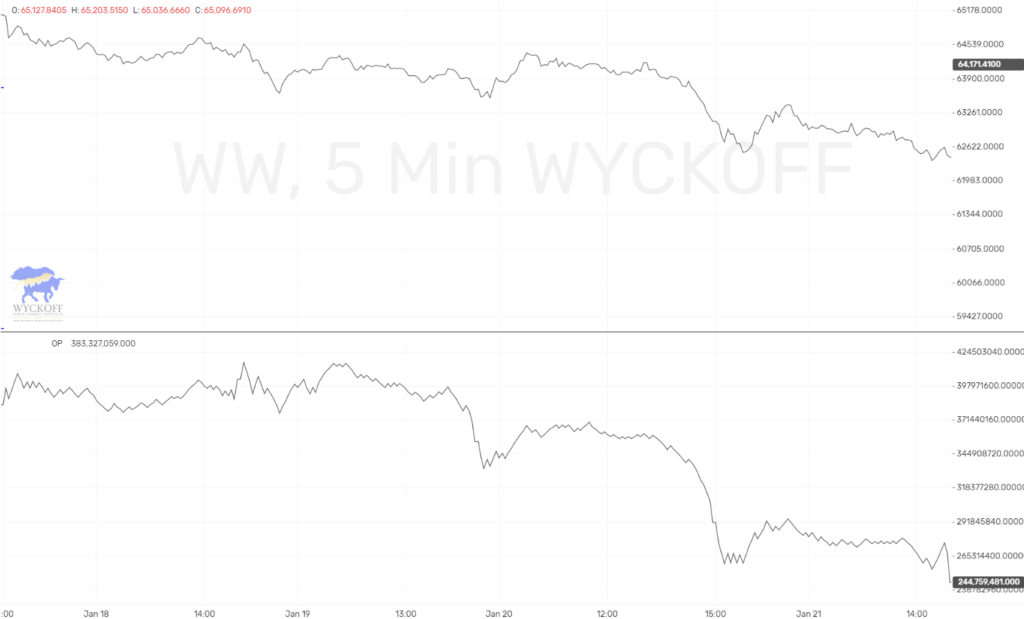
The Wyckoff Wave and OP are moving in unison.
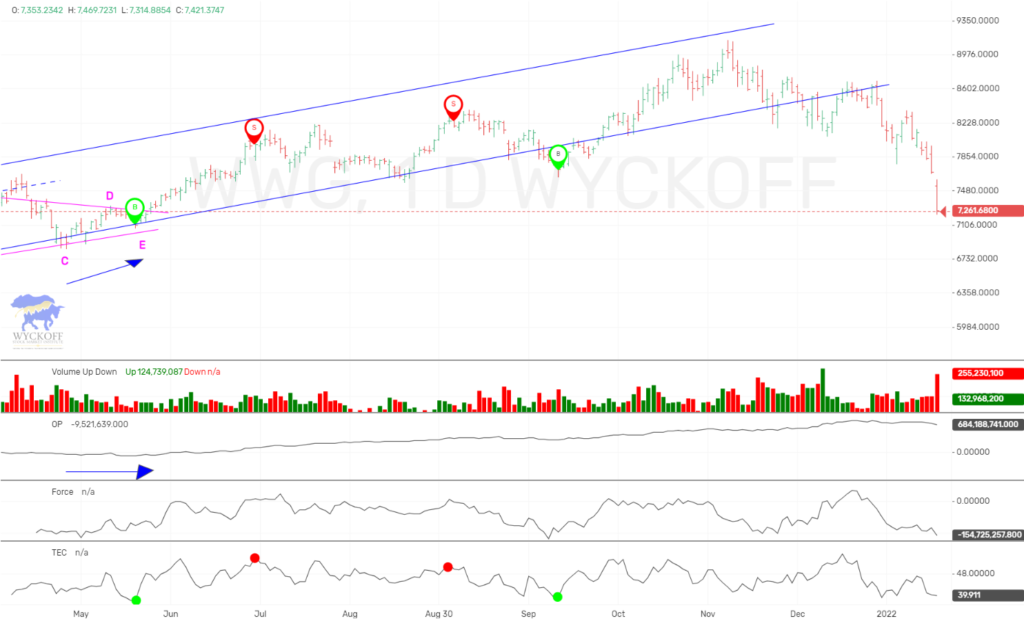
The Wyckoff Wave Growth Index was down sharply as well on average volume.
We was expecting some further strength and an overbought Technometer before we tried the downside again. Instead, we began the week with selling and ended the week with intense selling. Once again we have a Technometer reading near oversold, so we still think this selling will stop and we will get a recovery rally at minimum.
If we do get a rally, we will gauge the strength of the rally to determine if we have made a much more important top in November then we thought.
Technometer is now near oversold with a reading of 39.91.
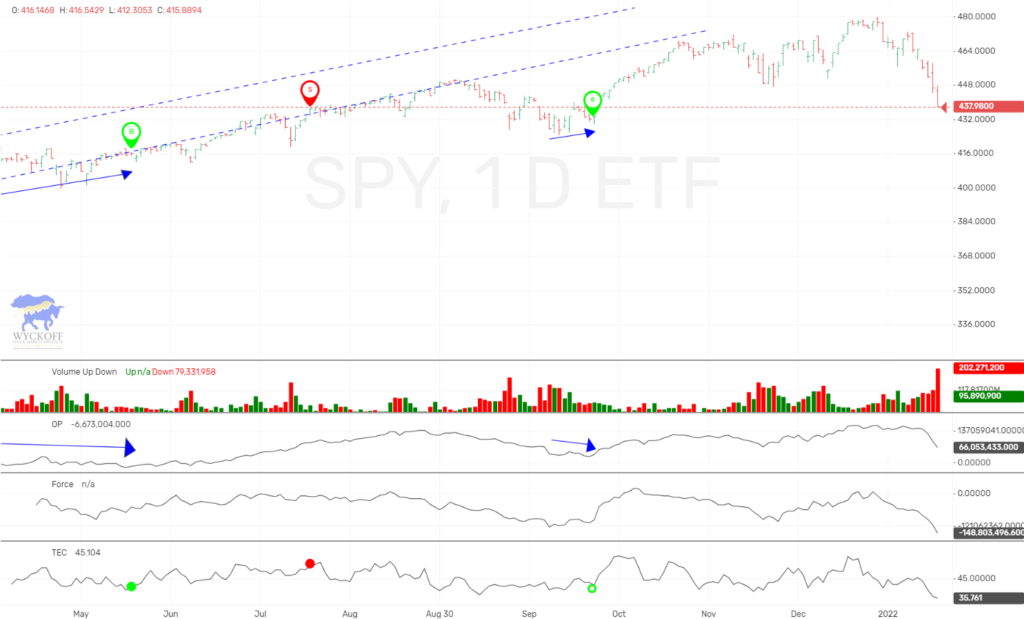
The SPY closed sharply lower for the week, with slightly higher volume.
The SPY had increased selling last week, and we pierced the 448 level. With the deeply oversold Technometer we could still be experience a “spring” of this level, and could see a sharp reversal higher. We will watch early week action, to see if this is the case. We also have previous support in the 425-430 level that could stop the decline.
The Technometer is deeply oversold at a reading of 35.76.
If you want more current up to the minute updates and trades as shown above, please join our ProTraders/Private Stock Discord. Join Here
If you are a Crypto Discord Member, and would like the ProTraders/Private Stock Discord as well, you can have access for only $20 a month. Join Here
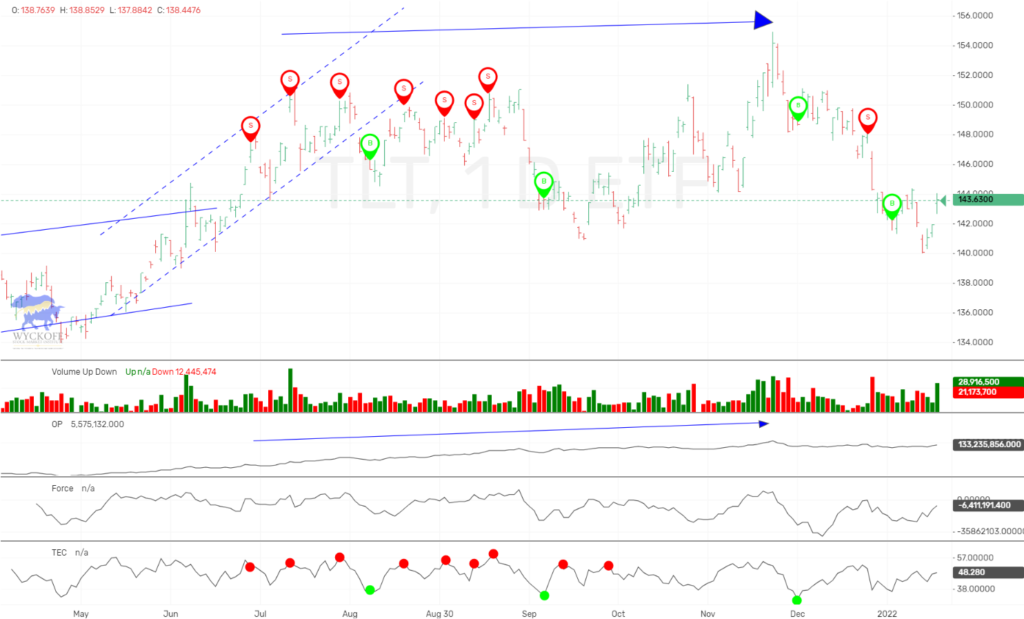
The bond market closed the week higher. We had expected a rally in the bonds last week, which once again will probably be met with selling. The Technometer is nearing overbought so we would expect a little more strength, and then possibly a short term top again.
The Technometer is near overbought with a reading of 48.28.
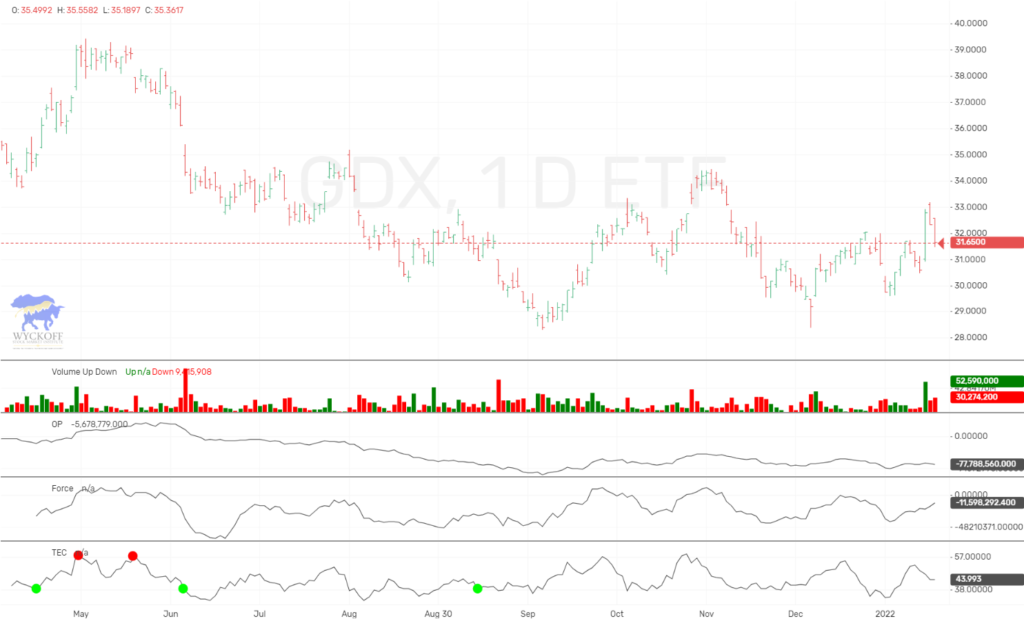
The GDX closed the week slightly higher, after giving up strong gains on Wednesday.
The Technometer is now back to neutral, and we are still seeing no clear cut indications for future direction. We are on the sidelines.
Technometer is neutral with a reading of 43.99.
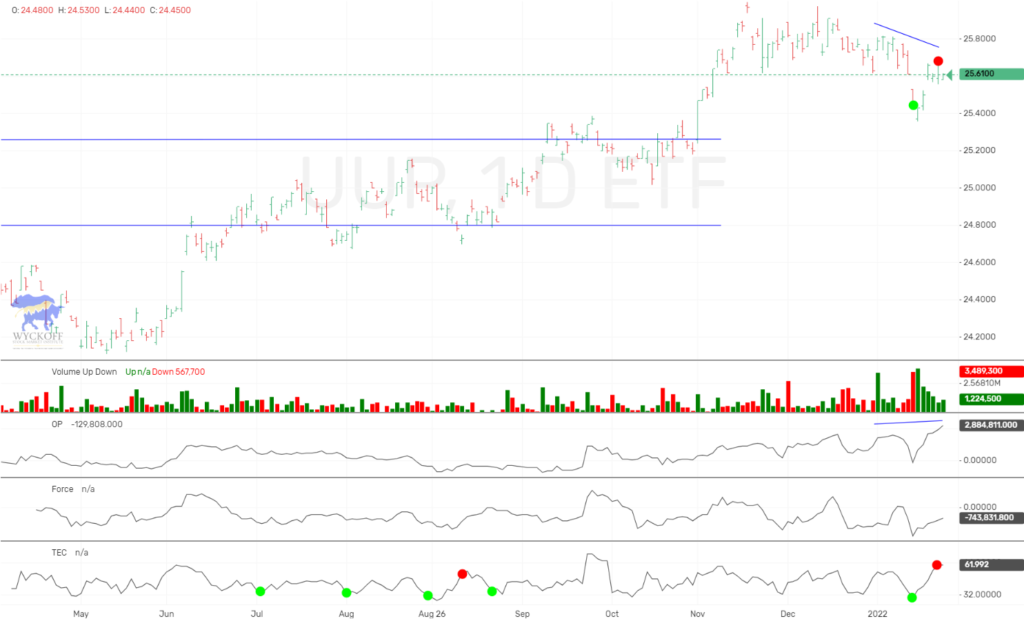
The long dollar ETF, UUP closed slightly higher as expected.
The Technometer has returned to major overbought with a reading of 61.99. We have now rallied back to what was previous support, so we look for the Dollar to rollover here once again.
The Technometer is major overbought with a reading of 61.99.
IMPORTANT ANNOUNCEMENT:
We have just released a lower cost version of our Unleashed Course, which is an excellent value at $349.99. Click Here
Our new “Pulse of The Market” charting software for Cryptocurrrencies is now showing consolidated volume from over 140+ exchanges. This is utmost important when applying Wyckoff Technical Analysis. We are showing this software in use on our social media sites, and will be launching for subscription in near future.
We have an active Discord channel where we discuss the Crypto markets. We have had huge success and if you trade Bitcoin you might like monthly access at $40 a month. Join Here
Due to the demand for Bitcoin/Cryptocurrency information and trading knowledge, we released a Cryptocurrency and Wyckoff Trading Course at our site, LearnCrypto.io This course is being offered at an affordable $299.99. We have had 1029 students enroll since its launch on June 22, 2017. On June 28th, 2018 we added lessons detailing the OP, Force, and Technometer and how to use these Wyckoff Tools for analysis.
If you are interested in Wyckoff stock chart analysis as well as Cryptocurrency, search “Learn Crypto / Wyckoff SMI” or click this link https://www.youtube.com/channel/UCDxK2PwEDvoaHZgjPV_WgcA
Please subscribe and click the bell to be notified of our upcoming broadcasts.
If you would also like to follow us on twitter for news and trade ideas, follow “WyckoffonStocks“, “LearnCryptoShow“, or “WyckoffonCrypto“. We have given numerous profitable trades to our subscribers on the Youtube channel, as well as Twitter.
Good Trading,
Todd Butterfield
Responses