Wyckoff Wave Close To Making A Decision.
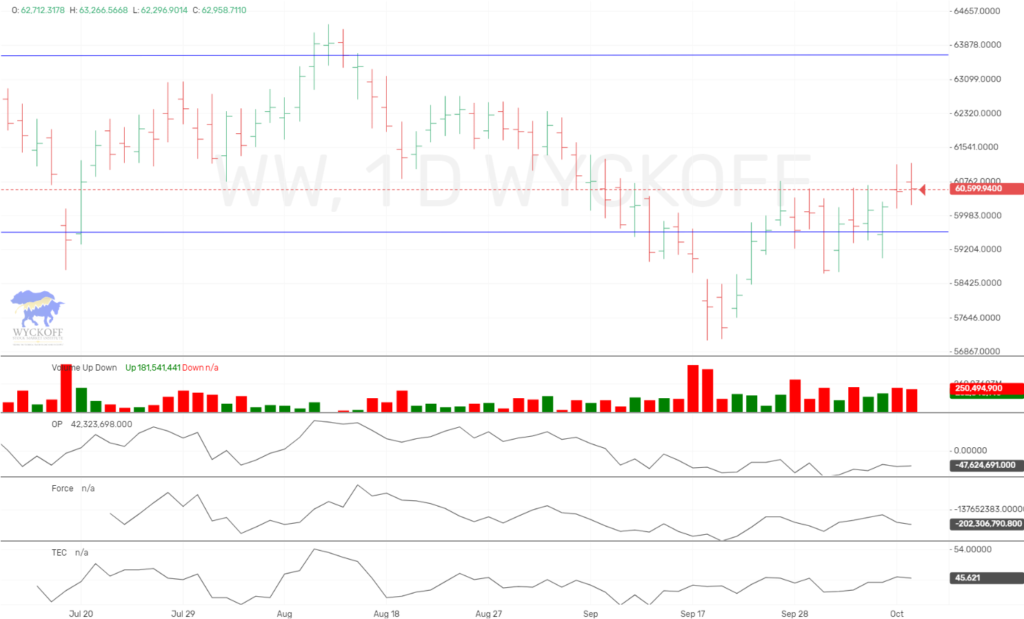
The Wyckoff Wave was up slightly for the week as expected. Volume was average.
The O-P was up for the week as well.
The Force Index was down slightly for the week.
The Wave fell below the recent support line three weeks ago, and since has tried to rally strongly back above it to confirm a Spring/Test. This lack of strength is concerning, and could warn that we have instead experienced a Sign of Weakness, and rally back for Last Point Of Supply. We will watch early in the week for more clues.
The Technometer is at 45.6, and will be an issue if it gets to overbought on a small low volume rally.
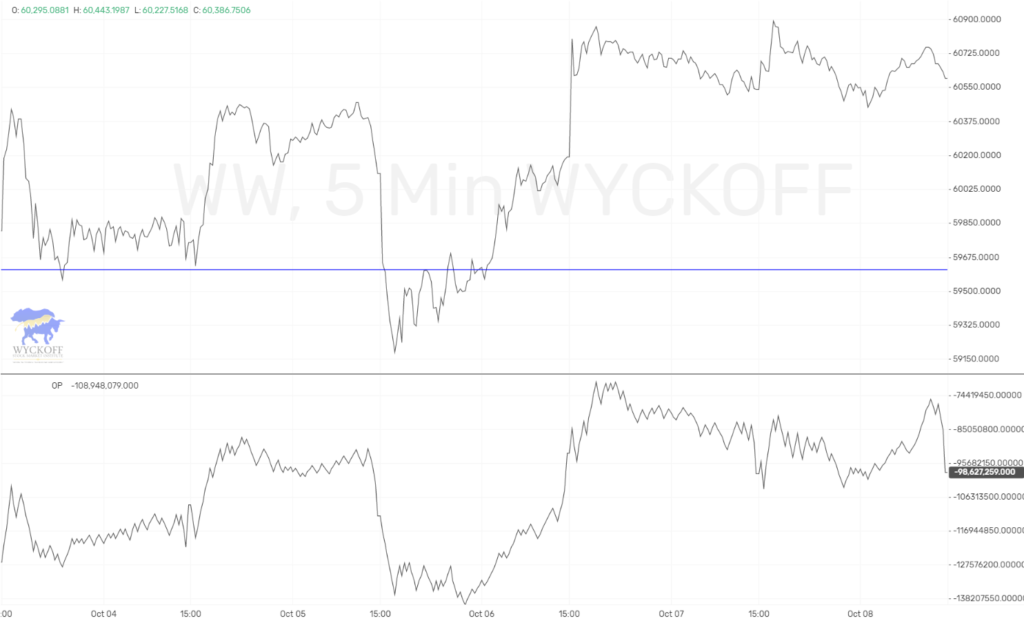
Last week the Wave and OP traded in unison.
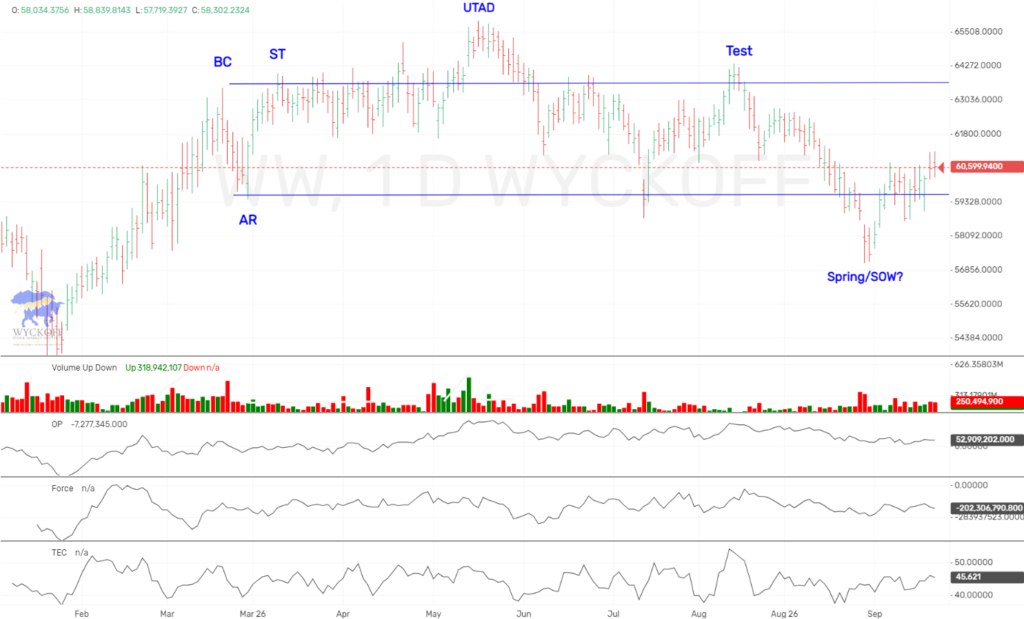
In the larger picture for the Wyckoff Wave, we have fallen thru the ice, or are springing the support level. Previous we had thought it was a fall thru the ice, and rally back. Then we gave the benefit last week that it was a successful spring and a test. We are now back to being worried that it is a sign of a weakness, and a last point of supply. Lets observe action closely from here……
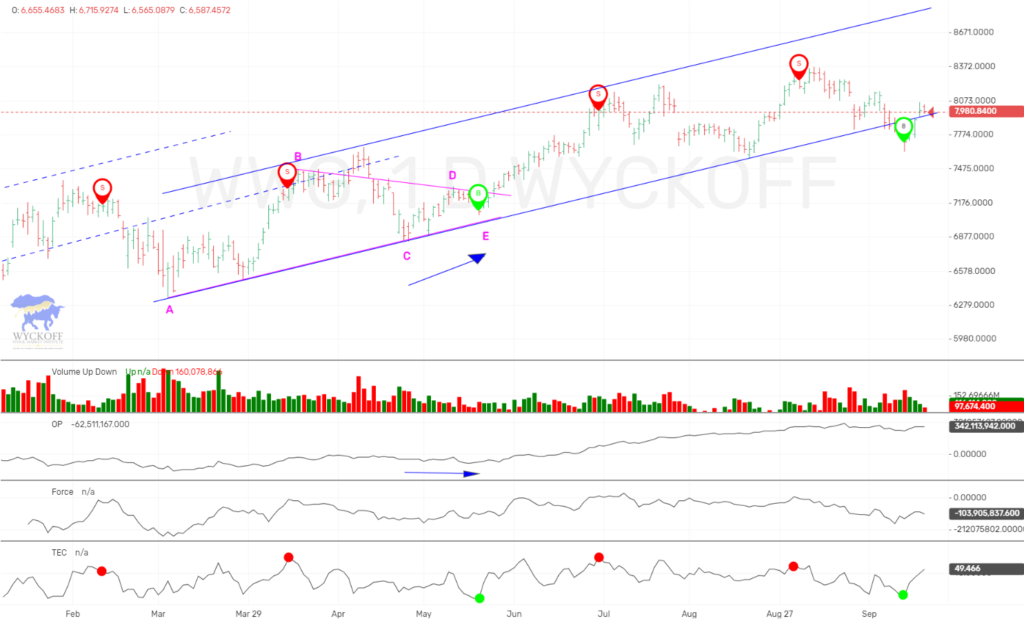
The Wyckoff Wave Growth Index (WWG) finished the week higher as expected after Monday’s selloff, but volume decreased every day on the recovery. We are now back in the uptrend, but the action does not look that positive. With the Technometer now back to overbought, the rally appears nearing an end and we will test Monday’s low again. If that does not hold, we could be in for some selling pressure.
Technometer is now overbought at a reading of 50.9.
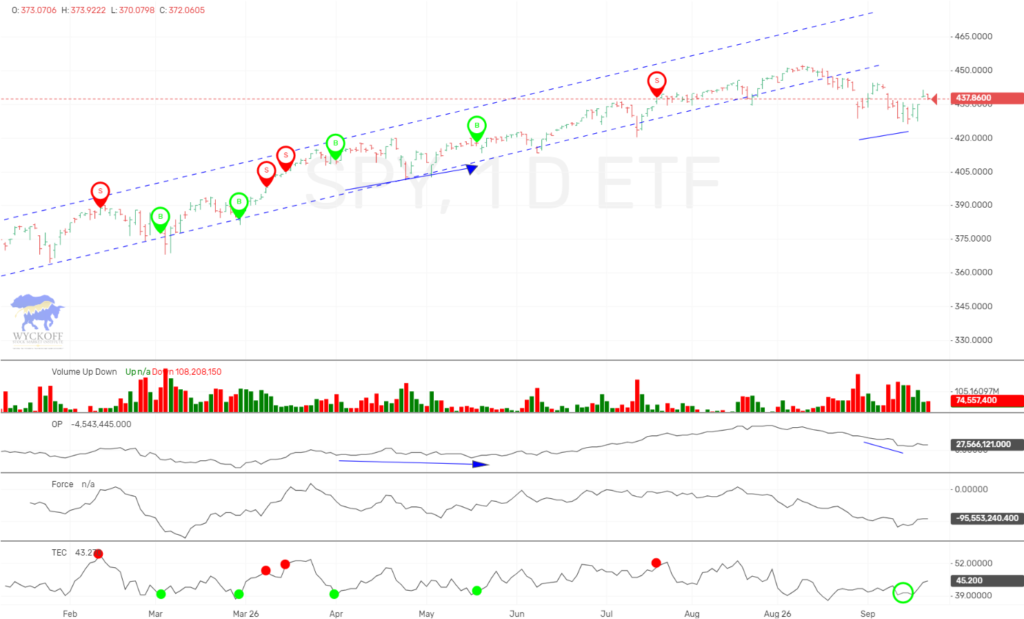
The SPY finished the week higher as well.
We thought the weeks before action was slightly positive which lead to this weeks small rally off the lows. The action now does not look that positive. We need to see more strength/volume come in early in the week, or we could be in trouble here as well.
The Technometer is near neutral at a reading of 45.2. We will be watching this reading to see if we get near oversold, or overbought this week.
If you want more current up to the minute updates and trades as shown above, please join our ProTraders/Private Stock Discord. Join Here
If you are a Crypto Discord Member, and would like the ProTraders/Private Stock Discord as well, you can have access for only $20 a month. Join Here
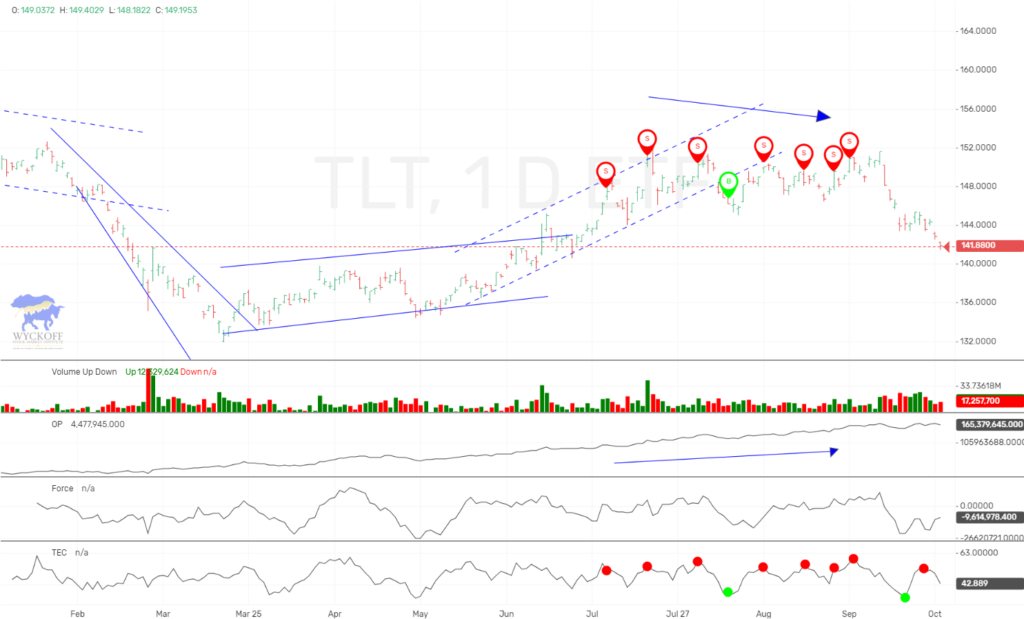
The bond market was down for the week as expected. The Technometer moving to overbought again quickly last week, brought in another down move for the bonds. We are now back to a neutral reading, and see a little more selling in the TLT before a good low can be made.
The Technometer is slightly below neutral, with a reading of 42.9.
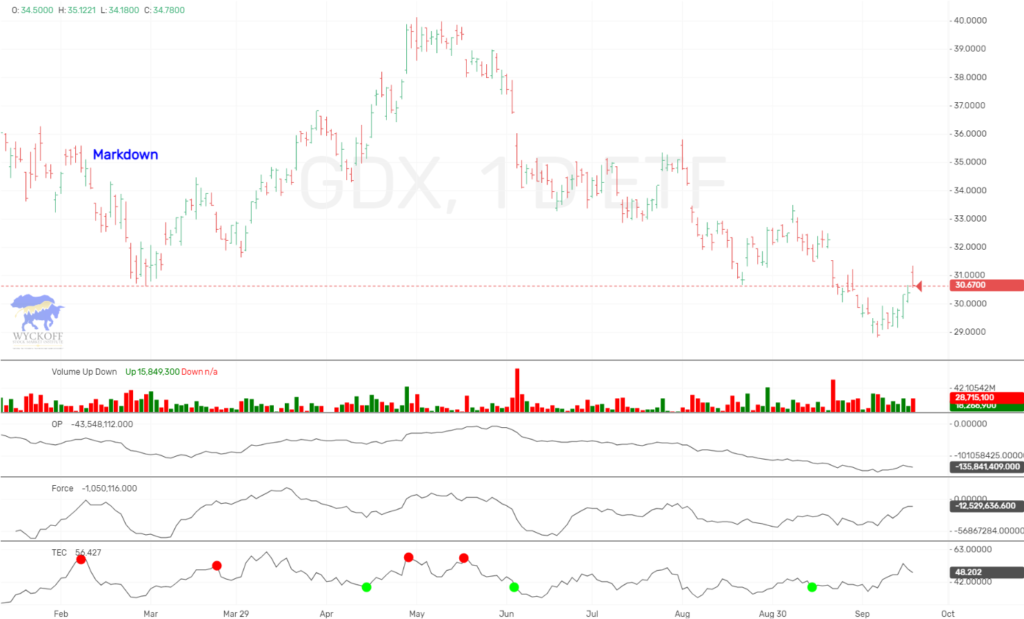
The GDX finished the week higher.
Technometer was overbought on Wednesday, and currently still high. We think this market is making a low, but we are on the sidelines.
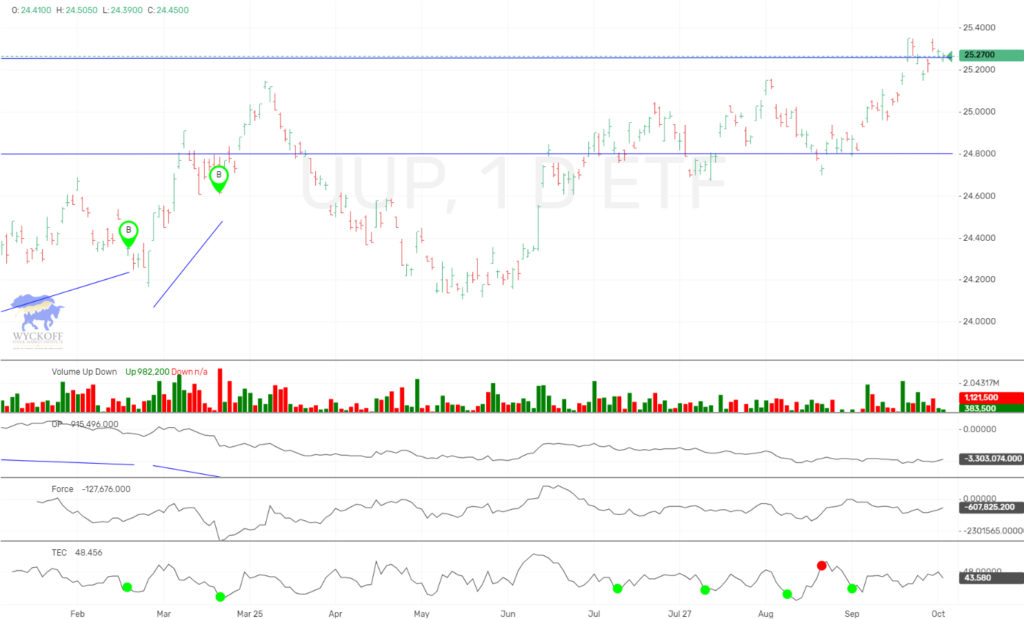
The long dollar ETF, UUP was flat.
The Technometer is neutral and we have no position/opinion. We will watch this market for a possible upthrust.
IMPORTANT ANNOUNCEMENT:
We have just released a lower cost version of our Unleashed Course, which is an excellent value at $349.99. Click Here
Our new “Pulse of The Market” charting software for Cryptocurrrencies is now showing consolidated volume from over 140+ exchanges. This is utmost important when applying Wyckoff Technical Analysis. We are showing this software in use on our social media sites, and will be launching for subscription in near future.
We have an active Discord channel where we discuss the Crypto markets. We have had huge success and if you trade Bitcoin you might like monthly access at $40 a month. Join Here
Due to the demand for Bitcoin/Cryptocurrency information and trading knowledge, we released a Cryptocurrency and Wyckoff Trading Course at our site, LearnCrypto.io This course is being offered at an affordable $299.99. We have had 1028 students enroll since its launch on June 22, 2017. On June 28th, 2018 we added lessons detailing the OP, Force, and Technometer and how to use these Wyckoff Tools for analysis.
If you are interested in Wyckoff stock chart analysis as well as Cryptocurrency, search “Learn Crypto / Wyckoff SMI” or click this link https://www.youtube.com/channel/UCDxK2PwEDvoaHZgjPV_WgcA
Please subscribe and click the bell to be notified of our upcoming broadcasts.
If you would also like to follow us on twitter for news and trade ideas, follow “WyckoffonStocks“, “LearnCryptoShow”, or “WyckoffonCrypto”. We have given numerous profitable trades to our subscribers on the Youtube channel, as well as Twitter.
Good Trading,
Todd Butterfield
Responses