Wyckoff Wave On The Support Line.
The Wyckoff Wave was up for the week, after Monday’s sharp selloff. Volume was flat.
The O-P was up for the week.
The Force Index was also up for the week.
The Wave fell below the recent support line, then spent the rest of the week rallying back to it. It looks much like a rally back to the ice. We will give it early next week to see how price behaves at this level.
The Technometer is at 45.8 and could overbought quickly on further rally.
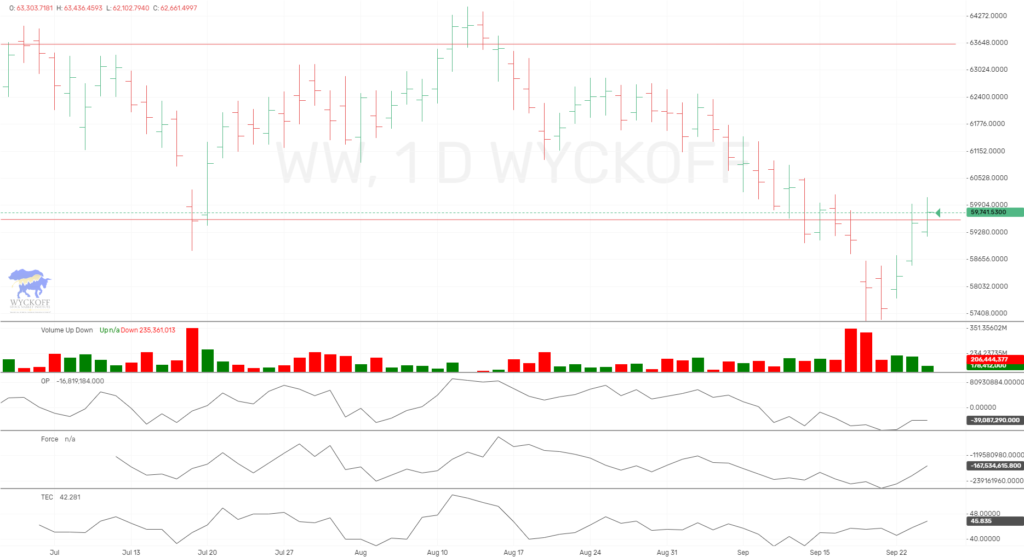
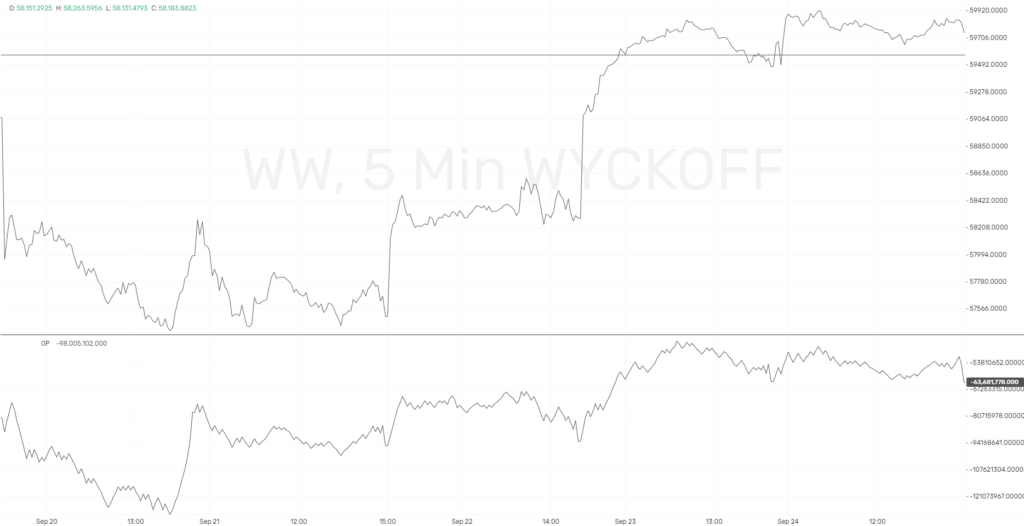
Last week the Wave and OP traded in unison.
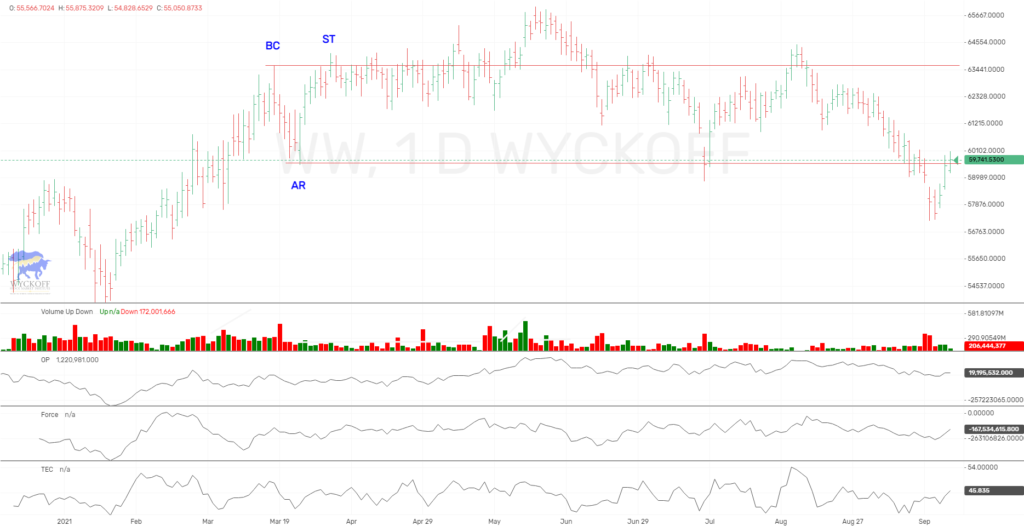
In the larger picture for the Wyckoff Wave, we have fallen thru the ice, or are springing the support level. Currently I think the odds are a fall thru the ice and rally back. As previously mentioned, the next few months are historically not good stocks.
The Technometer is above neutral. If we get overbought soon, we will be look at shorting opportunities.
The Wyckoff Wave Growth Index (WWG) finished the week unchanged, after Monday’s selloff. Volume is not coming into the upside aggressively and looks like we have more sideways or down in near future.
Technometer is quickly nearing overbought, so we will monitor this early in the week.
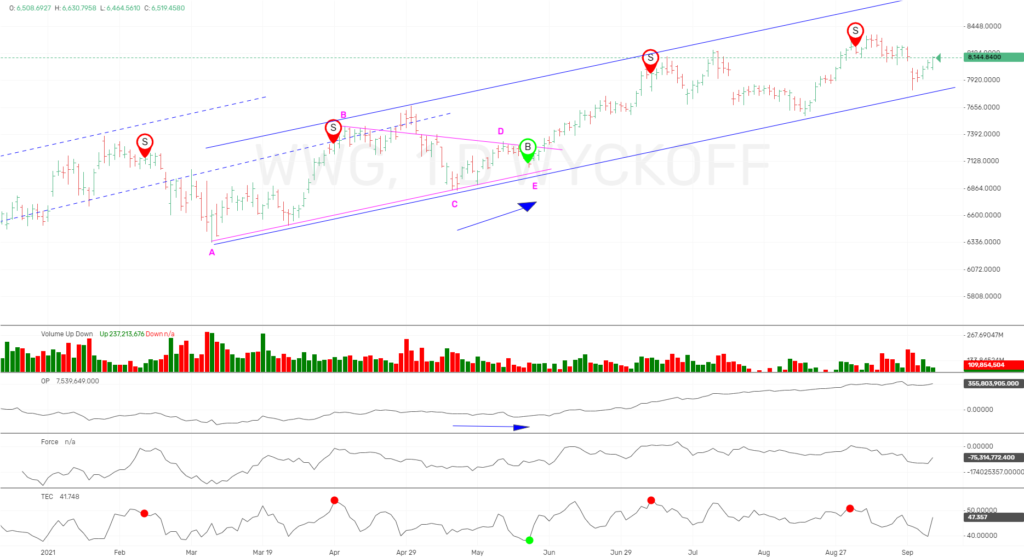
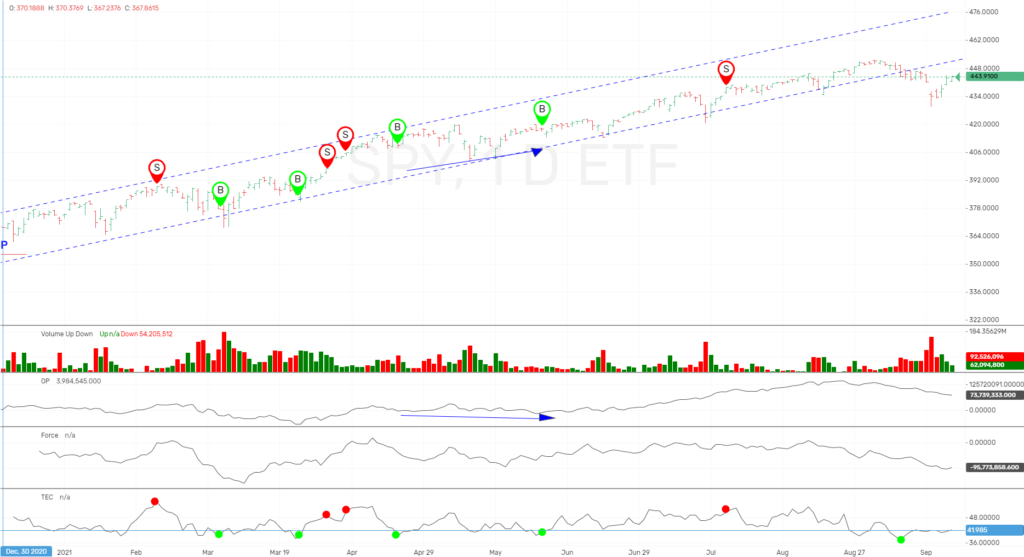
The SPY finished the week slightly higher as well.
We solidly broke the intermediate uptrend and now testing the underside. Action does not look bullish, but we could just be beginning some sideways action during this historically rough period for stocks. My guess is this could begin some reaccumulation for still higher prices later. Only I guess, but we will watch action for any clues in the coming weeks.
The Technometer is still near oversold at 41.8. As you can see from last weeks OP action, it continues to hit new lows while price is solidly higher last 3 days. On any weakness early in the week, the Technometer could return to oversold, and allow us to try the upside again.
If you want more current up to the minute updates and trades as shown above, please join our ProTraders/Private Stock Discord. Join Here
If you are a Crypto Discord Member, and would like the ProTraders/Private Stock Discord as well, you can have access for only $20 a month. Join Here
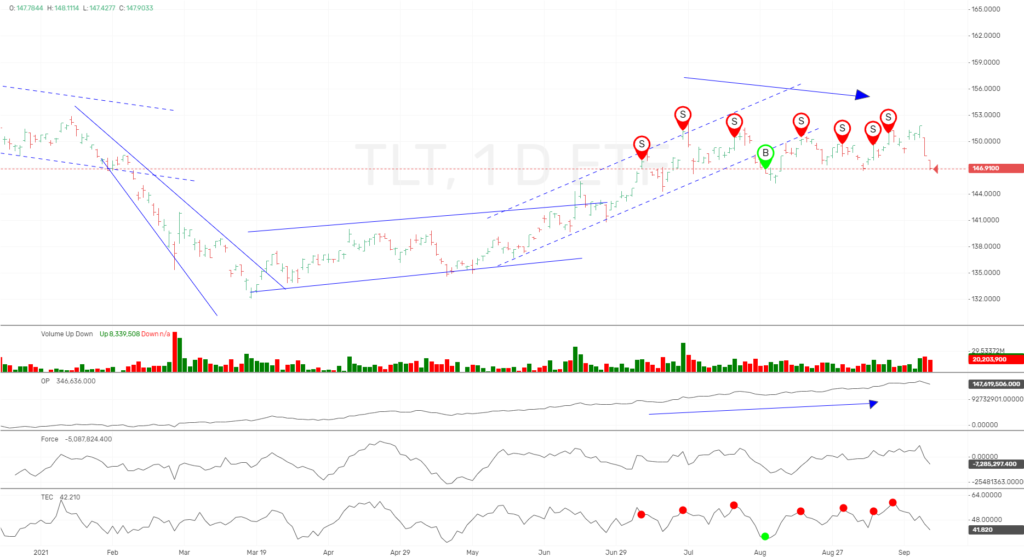
The bond market was down for the week as expected, with selling coming in aggressive late in the week. The overbought Technometer readings and negative divergence between price/OP finally exerted itself.
The Technometer is nearing oversold, but this market should be able to still work lower this week.
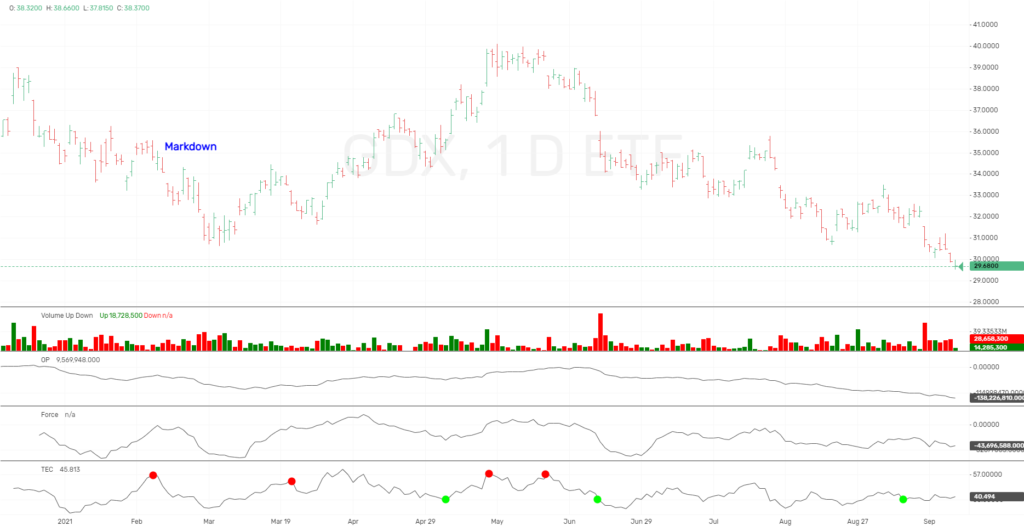
The GDX finished the week lower, against our short term bullishness.
Technometer is still near oversold, and we think downside is limited, but have no position or strong opinion currently.
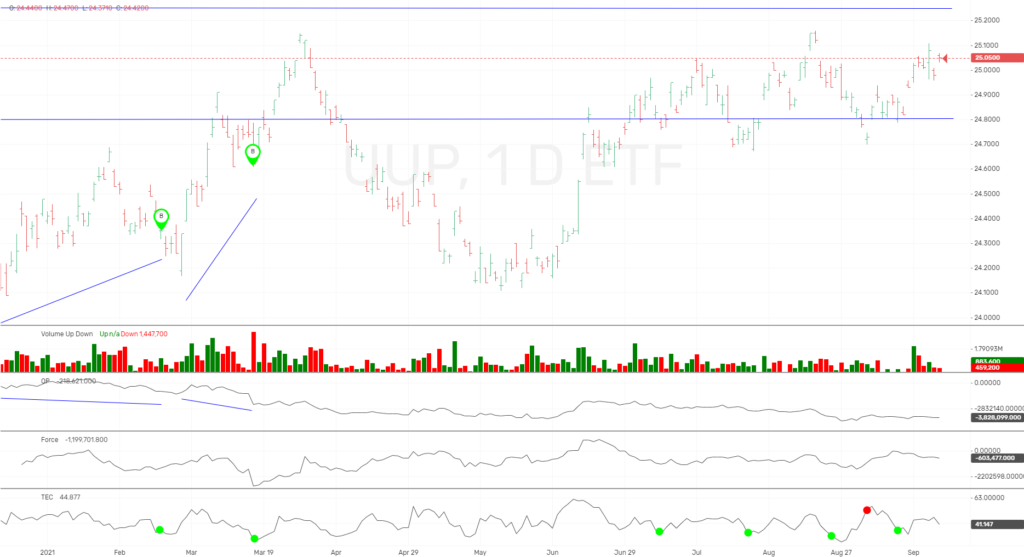
The long dollar ETF, UUP was up slightly for the week.
The Technometer is still near oversold, so we will stand aside for now.
IMPORTANT ANNOUNCEMENT:
We have just released a lower cost version of our Unleashed Course, which is an excellent value at $349.99. Click Here
Our new “Pulse of The Market” charting software for Cryptocurrrencies is now showing consolidated volume from over 140+ exchanges. This is utmost important when applying Wyckoff Technical Analysis. We are showing this software in use on our social media sites, and will be launching for subscription in near future.
We have an active Discord channel where we discuss the Crypto markets. We have had huge success and if you trade Bitcoin you might like monthly access at $40 a month. Join Here
Due to the demand for Bitcoin/Cryptocurrency information and trading knowledge, we released a Cryptocurrency and Wyckoff Trading Course at our site, LearnCrypto.io This course is being offered at an affordable $299.99. We have had 1027 students enroll since its launch on June 22, 2017. On June 28th, 2018 we added lessons detailing the OP, Force, and Technometer and how to use these Wyckoff Tools for analysis.
If you are interested in Wyckoff stock chart analysis as well as Cryptocurrency, search “Learn Crypto / Wyckoff SMI” or click this link https://www.youtube.com/channel/UCDxK2PwEDvoaHZgjPV_WgcA
Please subscribe and click the bell to be notified of our upcoming broadcasts.
If you would also like to follow us on twitter for news and trade ideas, follow “WyckoffonStocks“, “LearnCryptoShow”, or “WyckoffonCrypto”. We have given numerous profitable trades to our subscribers on the Youtube channel, as well as Twitter.
Good Trading,
Todd Butterfield

Responses