
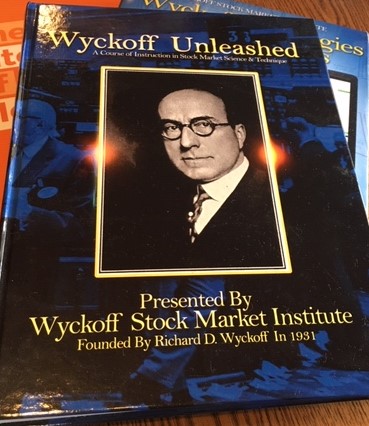


Todd W. Butterfield President | Chief Strategist Wyckoff Stock Market Institute
Todd W. Butterfield is President and Chief Educator of the Wyckoff Stock Market Institute and serves as the primary steward of the original Wyckoff methodology developed by Richard D. Wyckoff. With more than four decades of experience applying and teaching Wyckoff principles, Mr. Butterfield is dedicated to preserving the integrity of this time-tested market framework while adapting it for modern markets.
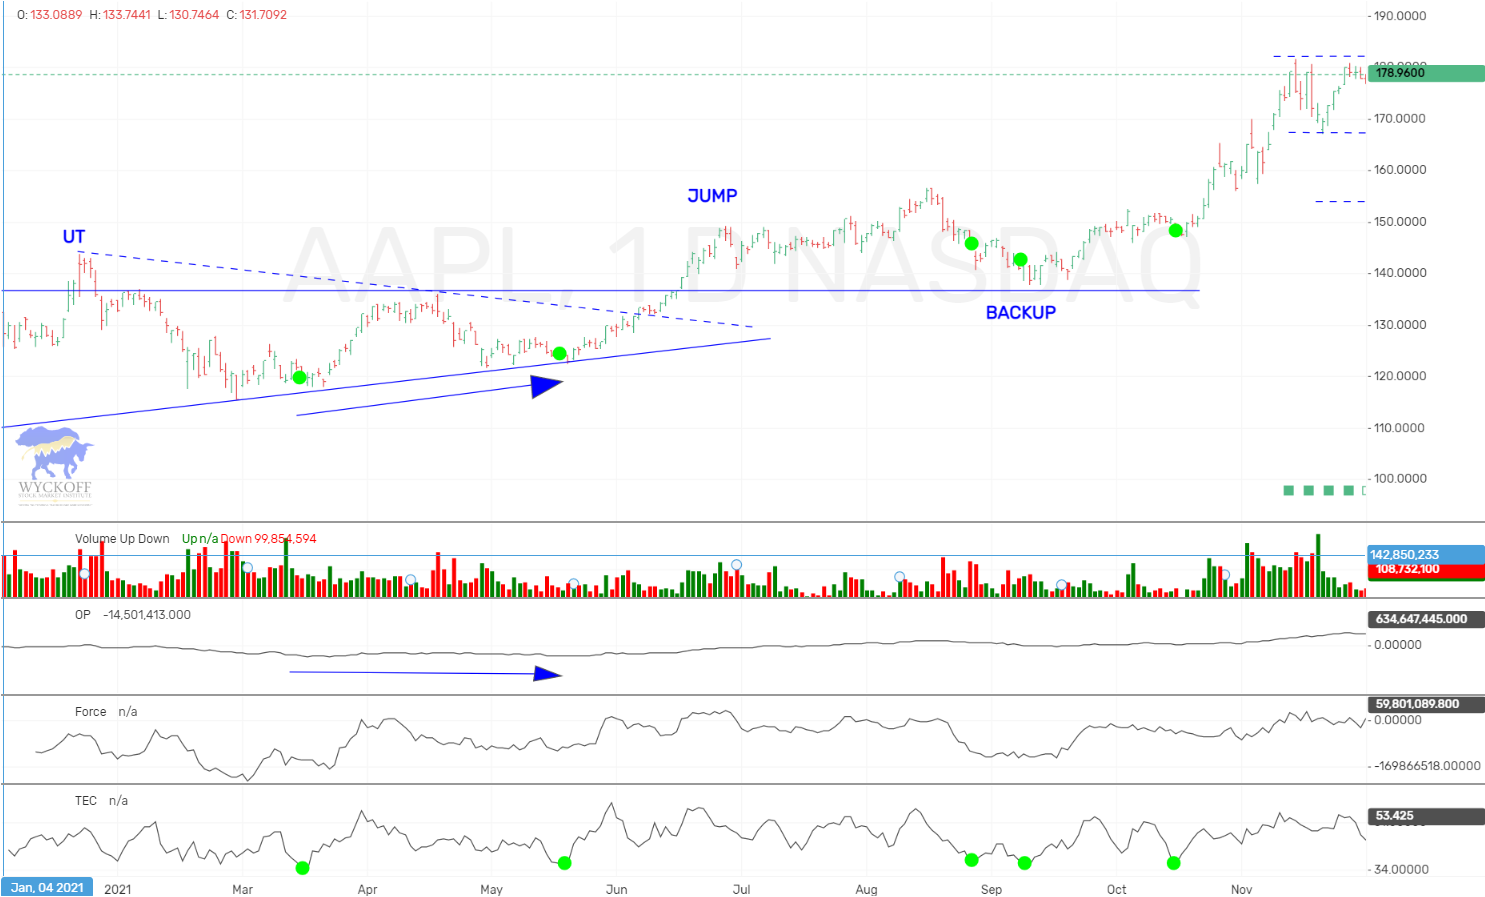
Mr. Butterfield graduated from the Wyckoff Stock Market Institute in 1982 and began applying Wyckoff principles in live market environments immediately thereafter. His early career focused on translating the theoretical foundations of price, volume, and supply-and-demand analysis into practical decision-making across equities, options, and commodities. He began his professional market career in 1984 as a trader with Rialcor Shatkin in Chicago, Illinois, where he gained direct experience navigating institutional market dynamics. In 1990, he registered as a Commodity Trading Advisor, followed by work as a Financial Consultant in the early 1990s. These roles deepened his understanding of both market mechanics and the responsibilities involved in advising and educating market participants. In 1997, Mr. Butterfield founded Butterfield Capital Advisors and Butterfield Futures, expanding his ability to provide fee-based investment advice as a Registered Investment Adviser while also offering futures brokerage services as an Introducing Broker. This dual perspective further shaped his emphasis on risk management, position sizing, and disciplined decision-making. In 2011, he formed The BlackBay Group, which includes BlackBay Capital Advisors, LLC. The firm was established to deliver structured, fiduciary investment management grounded in objective market analysis rather than prediction or speculation. In 2016, Mr. Butterfield assumed leadership of the Wyckoff Stock Market Institute and relaunched WyckoffSMI.com, restoring the original Wyckoff curriculum while expanding its application to contemporary markets. Under his direction, the Institute has continued to teach the full Wyckoff methodology — including market cycles, accumulation and distribution analysis, price-volume relationships, and risk-aware trade management — exactly as intended, without dilution or reinterpretation. Beginning in 2017, Mr. Butterfield extended Wyckoff education into the cryptocurrency markets, and launched LearnCrypto.io, demonstrating how Wyckoff principles apply across asset classes where supply, demand, and human behavior remain constant. In 2022, he launched WyckoffSMIChina.com to support a growing international community of students and professionals. Mr. Butterfield’s educational philosophy is centered on discipline, structure, and understanding market intent rather than prediction. His mission is to ensure that students of the Wyckoff Method learn how markets truly operate, enabling them to develop independent judgment, risk awareness, and long-term consistency.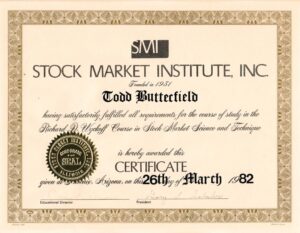
“12th in the Nation”, 31.9% (Feb 1-June 1), 85 Entrants, Futures Division, U.S. Investment Championship, 1984 Click here to view Barrons rankings.
Todd achieved a 79.8% average annual return, Commodity Trading Advisor 1987-1990 Click here to view Disclosure Document
In 1992, Todd Butterfield placed 34th in the U.S. Investment Championship $50,000+ “Stock Division” & 17th in the “Mutual Fund Switching Division”. Click here to view Barron’s rankings.
In 1993, Todd placed 4th in the Money Manager Verified Ratings “Low Risk Division” with a 28.1% return. ($1 Million-Plus Portfolio) Click here to view Barrons rankings
Todd placed “2nd in the Nation”, Money Manager Verified Ratings, 1st quarter, 1994.
In the 12 months ending 6/30/00, placed 2nd in the nation, Moni Research
11/30/2011 – 12/31/2011 : .32%
12/31/2011 – 12/31/2012 : 34.71%
12/31/12 – 7/31/2013 : 9.83%


 Subscribe