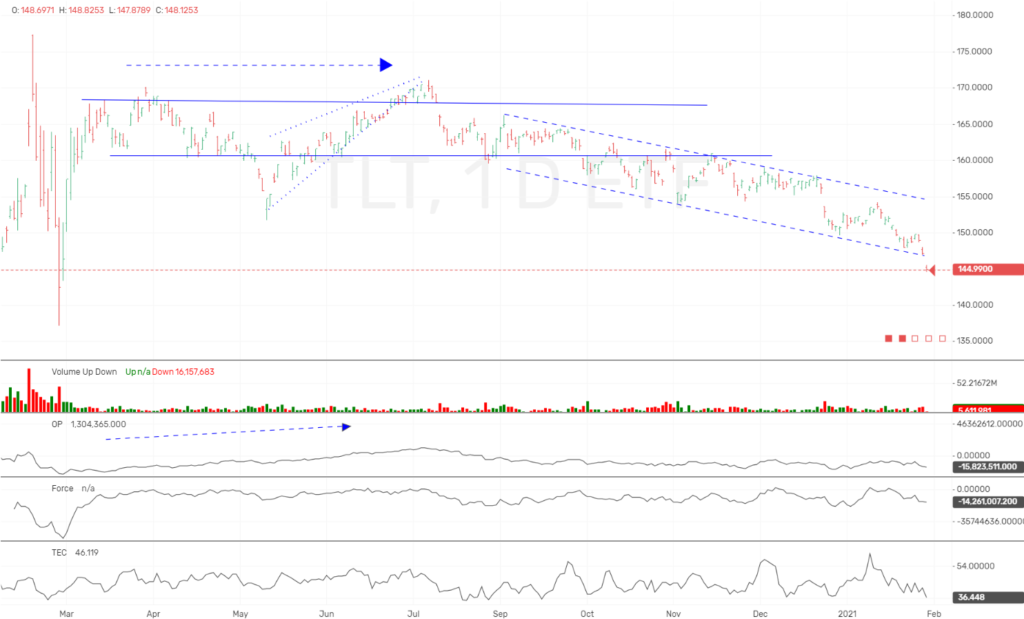
Buying TLT at the market. Current price $145.04

📊 Wyckoff Market Intelligence Scorecard Metric Current Reading Health NEUTRAL Execution HIGH Trend TRENDING UP Confirmation MIXED Condition EARLY IMPROVEMENT Cluster BREAKOUT Regime TRANSITION Market…

📋 Market ScoreCard General Market Condition: Corrective / Risk-OffWyckoff Bias: Distribution / Markdown pressure in major indexesTrend Structure: Weakening leadership, broad deterioration under resistanceTechnometer Condition:…

📋 Market ScoreCard Symbol Trend WyckoffSMI View SPY Range / Corrective Five-week consolidation continues as correction unfolds beneath the surface. QQQ Range / Mixed Technology…

📋 Market ScoreCard Symbol Condition WyckoffSMI View SPY Bullish Uptrend intact, extended short-term QQQ Bullish Technology leadership accelerating TLT Bearish Bias Weak rebound structure, lower…

📋 Market ScoreCard Symbol Condition WyckoffSMI View SPY Bullish Breakout trend intact, extended short-term QQQ Bullish Technology leadership accelerating TLT Bearish Bias Weak range structure,…
Please confirm you want to block this member.
You will no longer be able to:
Please note: This action will also remove this member from your connections and send a report to the site admin. Please allow a few minutes for this process to complete.
Responses