Reaction Back Into The Trading Range In Progress?
For the last month we have been expecting some type of reaction back into the trading range, and we gave the reasoning behind it. It is sounding like a broken record as we continue to see sideways action on low volume. With the holiday’s now behind us, we are expecting volatility and volume to pickup.
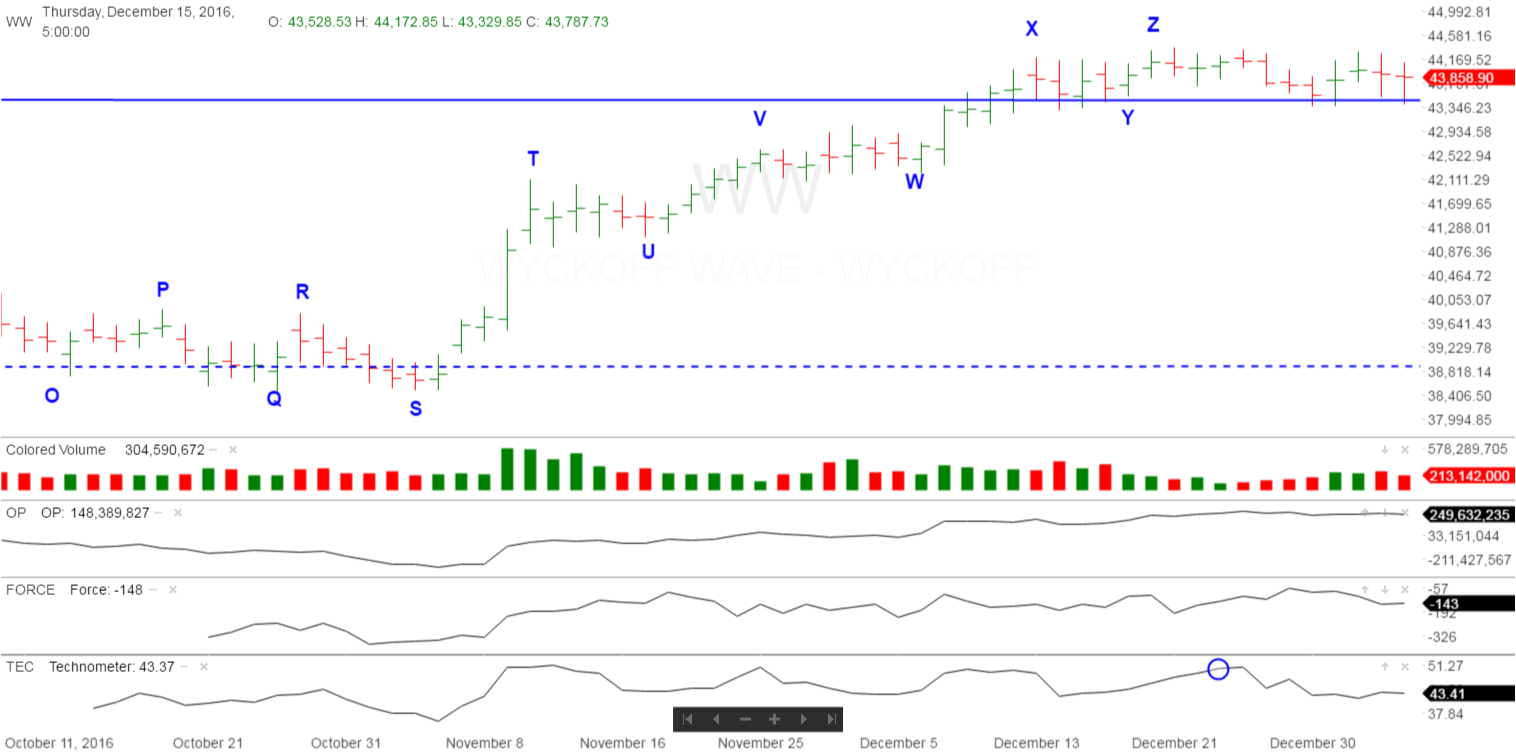
As we have discussed the last few weeks, the numerous rallies to “Z” appeared to happen with shortening thrusts, and lower price spread and volume. This type of action is not consistent with a Sign of Strength.
The recent rally to “Z” returned the Technometer to an overbought reading quickly with no material price gain in the Wave above “X”. We have circled this overbought reading on the Technometer with the blue circle at the bottom of the chart. We felt this action would finally give us a start of correction we have been looking for. Instead, it has been more of the same. The decline from “Z” has flirted with the previous low at “Y”, but so far has brought in no sustained selling. We need downside selling to come in here to get this correction started.
Not expected…but this pullback could possibly be a Last Point of Support (LPS), but our current indications is this is not true. If strong demand returns this week, we will re-evaluate this possibility.
The S&P and Nasdaq Indices were up approximately 1.2% for the week, and stronger than the Wyckoff Wave.
This past weeks action still supports the fact that the recent rally to “Z” is simply a rally to test the resistance at the top of the trading range. We therefore expect a correction back to the middle or lower portion of the recent trading range, and wait for ending action once again. Currently the supply at the top of the trading range has not been sufficient to turn the Wyckoff Wave back into the trading range.
The Optimism – Pessimism Index is in sync with the Wyckoff Wave.
The moderate negative readings from the Force Index has supported the idea of a correction here. The Force Index is at -143 which is applying some downside pull on the Wyckoff Wave.
The Technometer has had continued neutral reading all week and adds nothing new to the picture.
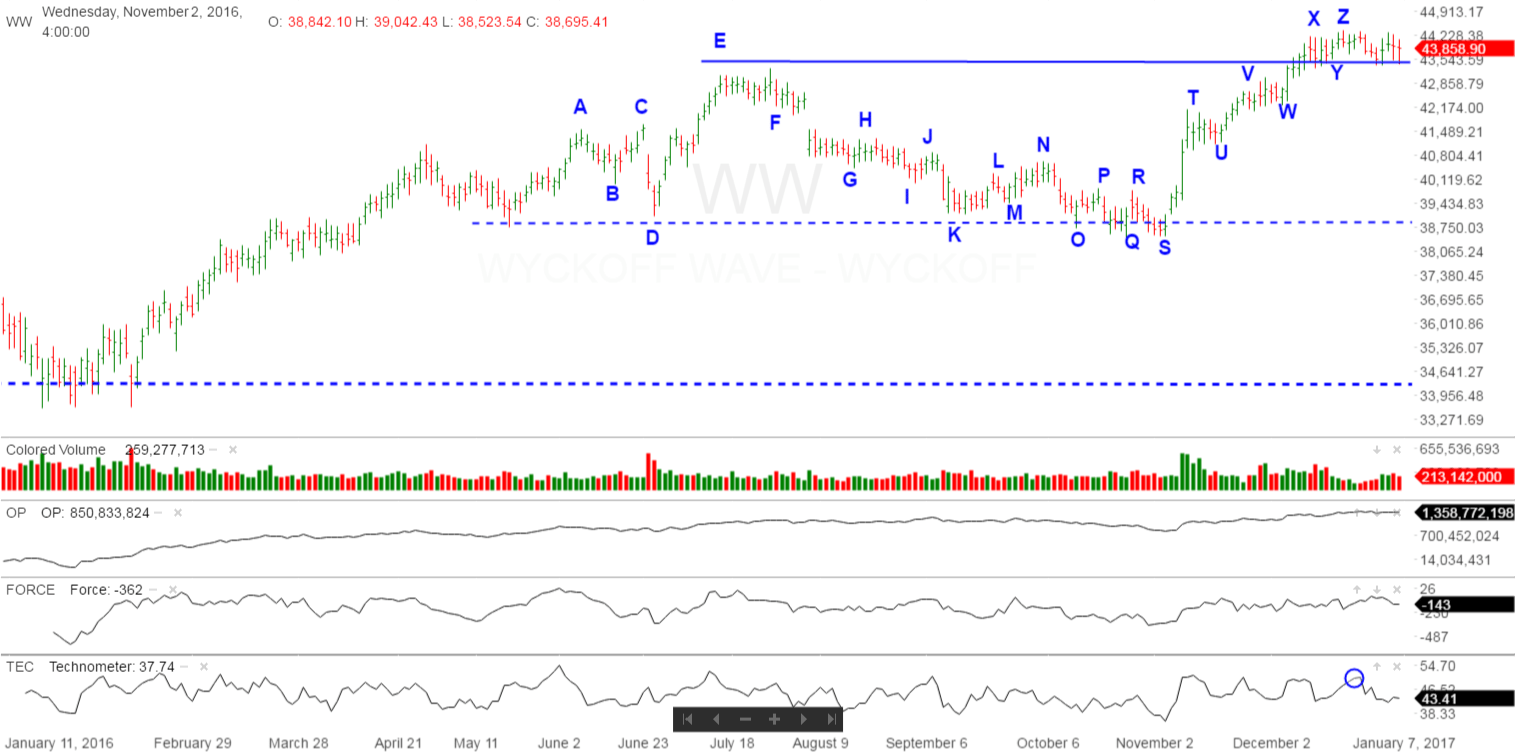
The recent trading action still supports the reaction scenario back into the middle of the recent trading range at “U”.
While the Wyckoff Wave will most probably not be putting in a Last Point of Support on any expected reaction here. If strong volume would come into the upside here, this scenario would have to be back on the table. The market action beginning with the selling climax in August 2015, continues to suggest we are in a period of accumulation. If so, the Wyckoff Wave would experience ending action and the bull market would then continue.
Good Trading,
Todd Butterfield
Responses